Introduction
Looking back over ten years of collecting data from pasture-based dairy farmers, it is encouraging to see that there has been progress made with regards to improved sustainability. Two of the main goals of Trace & Save is to support farmers to farm in a more sustainable manner and to create evidence of progress where it is being made.
Trace & Save uses the self-created SWAN system (What is the SWAN system?) to assess sustainability progress. We are very aware of the fact that it is not possible to deem a farm “sustainable” or “unsustainable”, therefore we focus on helping farmers to understand whether they are making progress relative to their own sustainability indicators. It is also possible to benchmark farmers against each other, and against best current indicator levels, which allows farmers to know where they are positioned with regards to their productivity and environmental impact. Although that is not the focus of this article. The focus of this article is to evaluate the progress that has been made on the farms that Trace & Save works with over the past 10 years.
The previous time we assessed the overall improvement of farms based on the SWAN system was in this article: What do the Trace & Save sustainability scores tell us? In that article we looked at 45 farms and examined whether the SWAN scores had improved or not. It showed that on those farms there had been improvements in the Soil, Water and, Atmosphere scores, whereas there had not been improvement in the Nutrient score. For this assessment, we are going to look at some of the actual indicators of sustainability that are contained within the SWAN system, and it includes almost double the number of farmers.
Trace & Save farmers
There are 96 farmers who have participated with Trace & Save over the past 10 years. Some started 10 years ago, and some only started last year. Therefore, there are a varying number of years’ data for each farm. For this assessment, only farms with at least two years’ data were included. This resulted in 87 farms being included, with an average of 5.4 years’ data (maximum = 10; minimum = 2). These farms are located throughout the main pasture-based dairy regions of South Africa, as per Table 1.
Table 1: Number of farms per region in South Africa
Assessing sustainability progress
To assess progress or regression in sustainability on pasture-based dairy farms, I have looked at the baseline value compared to the most recent value for sustainability indicators on farms. For some farms, the baseline and current values are only two years apart, whereas, for other farms, the baseline and current values are up to 10 years apart. The one weakness of such an assessment is that the baseline year might be an outlier, for example due to drought or excessive rain, a farm being in management transition, or any other reason behind a farm not having a “business as usual” year. Since this is an assessment of many farms, the overall trend will still be insightful. We are currently working on addressing this by using the first three years of a farms data to create the baseline, but this is still a work in progress and could not be included in this assessment.
Soil carbon
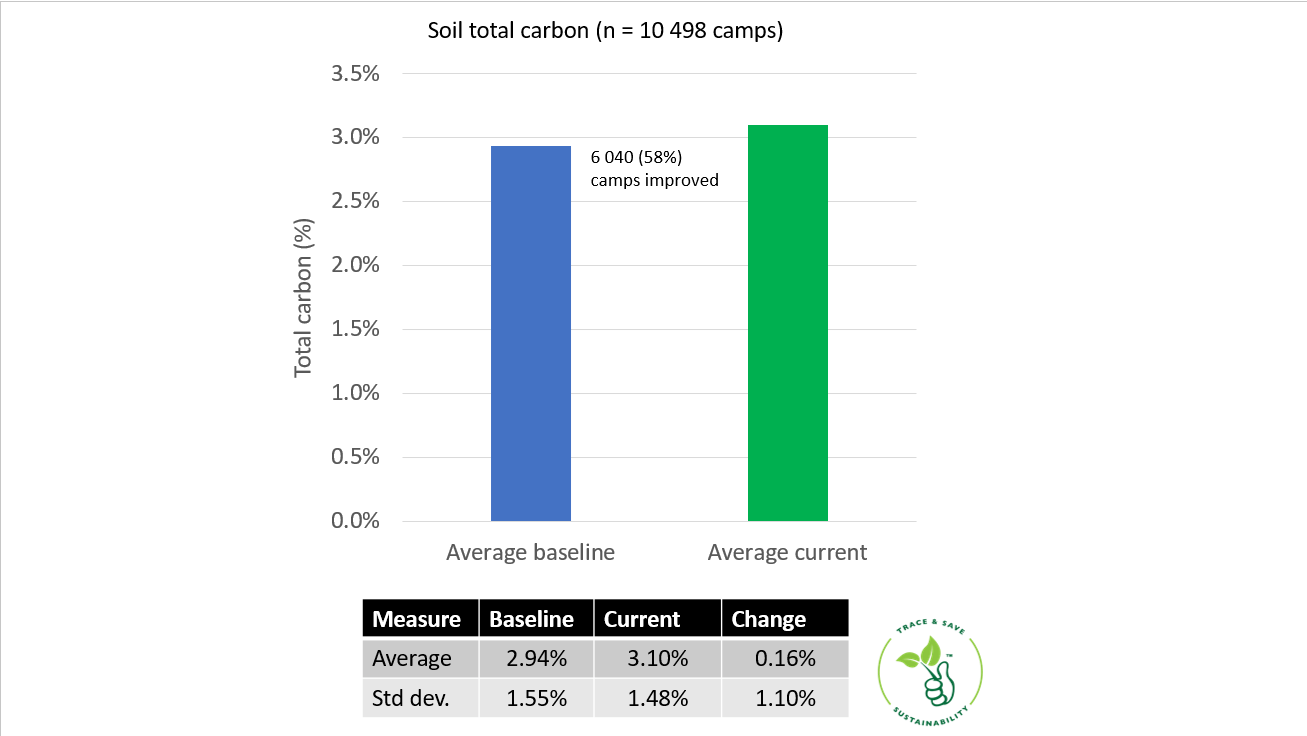
Soil carbon is the most important indicator of soil health. It is also an important indicator of the role of farms in mitigating climate change, as farms are able to store carbon in the soil, this is a positive contribution towards removing carbon from the atmosphere. For the soil carbon comparison, it was done per camp, not per farm. Therefore, it includes soil carbon measures from 10 498 camps. The comparison is the average between the baseline and current values per camp.
Figure 1 shows that the average soil total carbon levels have increased across the Trace & Save farms. The change does not seem significant (average change = 0.16%) and there is a lot of variation (standard deviation of the change = 1.10%). That said, a change of 0.16% at 15cm depth of sampling (about 3 tons of carbon per ha) across 10 498 camps, averaging 5 ha per camp, equates to an increase of about 577 390 tons CO2e stored in the soil. This would be enough to “sequester” 13% of the emissions from the 87 farms over an average of 5.4 years. Although these are very rough calculations, and should not be read into excessively, it does show that overall, these farms are contributing towards a lower net-emissions than what they are currently being assessed as having. This is also an area of large opportunity for farmers to continue to work on – there is still a great opportunity to increase soil carbon levels on farms in the future.
Figure 1: Average soil carbon per camp for baseline and current years
The average total carbon levels are relatively high, with 3.10% carbon being an optimal level. This also indicates the significant difference between the predominantly perennial pastures on pasture-based dairy farms and the degraded cropping systems of other types of agriculture (average organic matter levels in South African agricultural soils are less than 2%, i.e., 1.16% carbon1; and only 4% of soils in South Africa contain more than 2% organic carbon2). And most of these dairy farms are in areas with low (less than 2.00%) carbon levels in the natural vegetation.
Water use efficiency
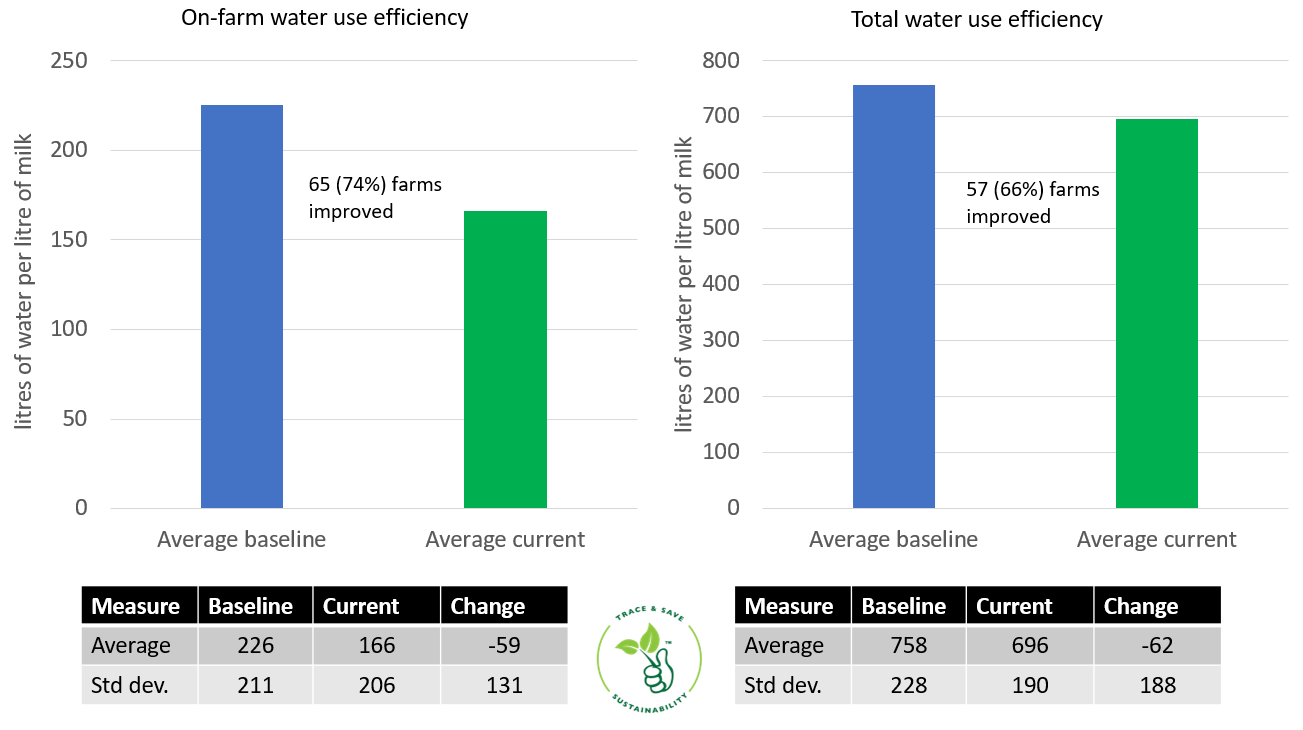
Water stewardship is imperative for sustainable agriculture. Water is a precious resource that needs to be used efficiently to produce food so as to limit wastage. The on-farm water use efficiency (WUE) is based on how much water is used on the farm by irrigation, animal drinking, and washing the dairy and yard, divided by the amount of milk produced by the farm. The total water use efficiency includes those on-farm water uses, along with the water footprint of the bought feed coming onto the farm, per litre of milk produced.
Figure 2: Average on farm and total water use efficiency for baseline and current years
Figure 2 shows that both on-farm and total WUE has decreased, on average, by 59 and 62 l/l respectively. The high standard deviations show that there is a lot of variability in WUE values across the farms, but the overall improvement is a great indication of improved water stewardship on these farms. It is also encouraging that 74% of the farms have improved their on-farm WUE, and 66% of farms their total WUE.
Carbon footprint
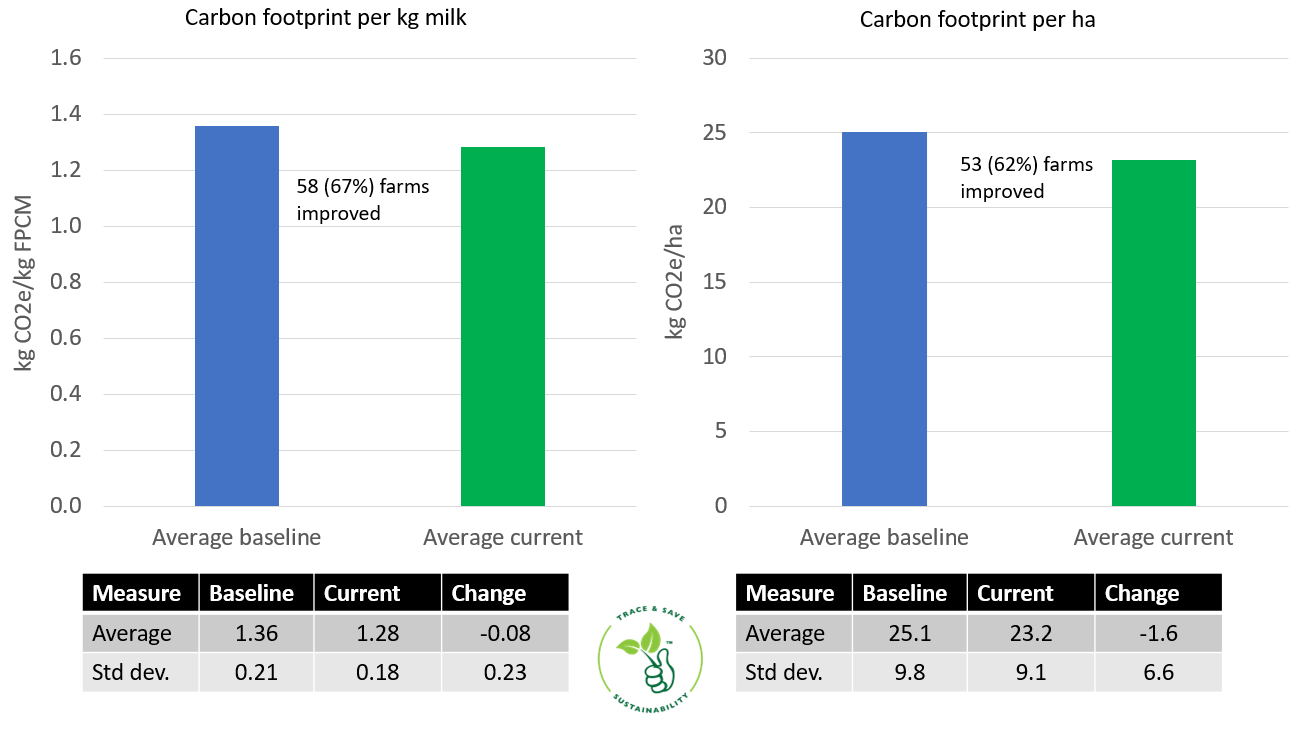
A carbon footprint is a calculation of the amount of greenhouse gas (GHG) emissions resulting from farming practices. GHG emissions contribute to global climate change. These emissions are then divided by milk production and per hectare as environmental impact indicators. The figure per milk production is important since this shows what environmental impact milk products have as bought by consumers, and it is important to reduce this figure for the sustainability of milk production. The GHG emissions per hectare are an important indicator of the environmental impact of each portion of land that is being farmed.
Figure 3: Average GHG emissions per kilogram of milk and per hectare for baseline and current years
Figure 3 indicates that both of these carbon footprint values have become lower on the Trace & Save farms when comparing baseline values to current values. Although the change does not seem big (-0.08 kg CO2e/kg FPCM, and -1.6 kg CO2e/ha) any reduction in GHG emissions is good progress, especially since about two-thirds of the farmers have shown reductions from their baseline values.
Nutrient utilisation
Nutrient use efficiency and nutrient excesses are indicators of potential pollution resulting from the inefficient use of nitrogen and phosphorous on farms. Excess nitrogen and phosphorous which enters water sources, and excess nitrogen that is released into the atmosphere causes pollution. These are some of the significant environmental impacts resulting from agricultural practices. In order to improve the sustainability of dairy farming, it is important to improve nitrogen use efficiency (NUE) and phosphorous use efficiency (PUE), and decrease the amount of excess N and P.
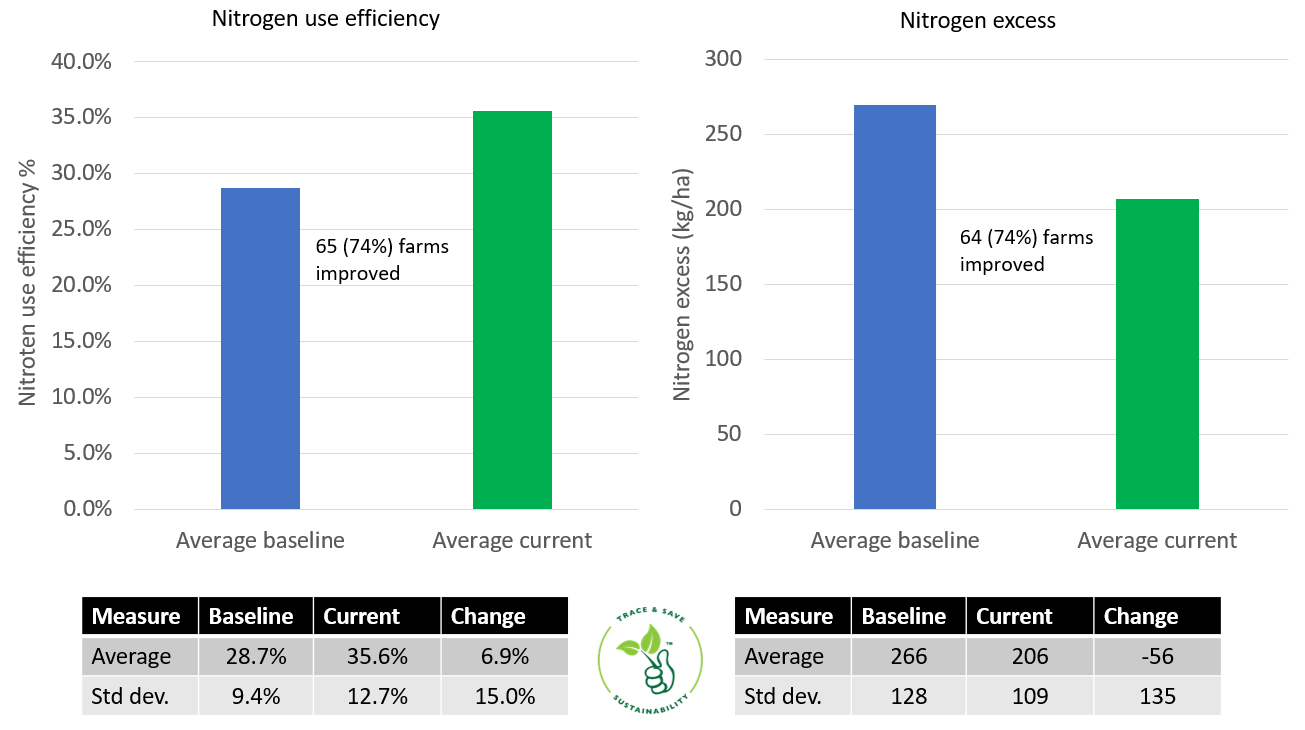
Figure 4: Average NUE and N excess for baseline and current years
Figure 4 shows that the NUE has improved on 74% of the farms by an average of 6.9% and that the N excess has decreased on 74% of the farms by an average of 56 kg N/ha. These are both large improvements and are the most significant improvements of all the results from this assessment. That said, the current averages of 35.6% NUE and 206 kg excess N/ha are not great, and even further improvement needs to be made by farmers to reduce the environmental impact of dairy farming.
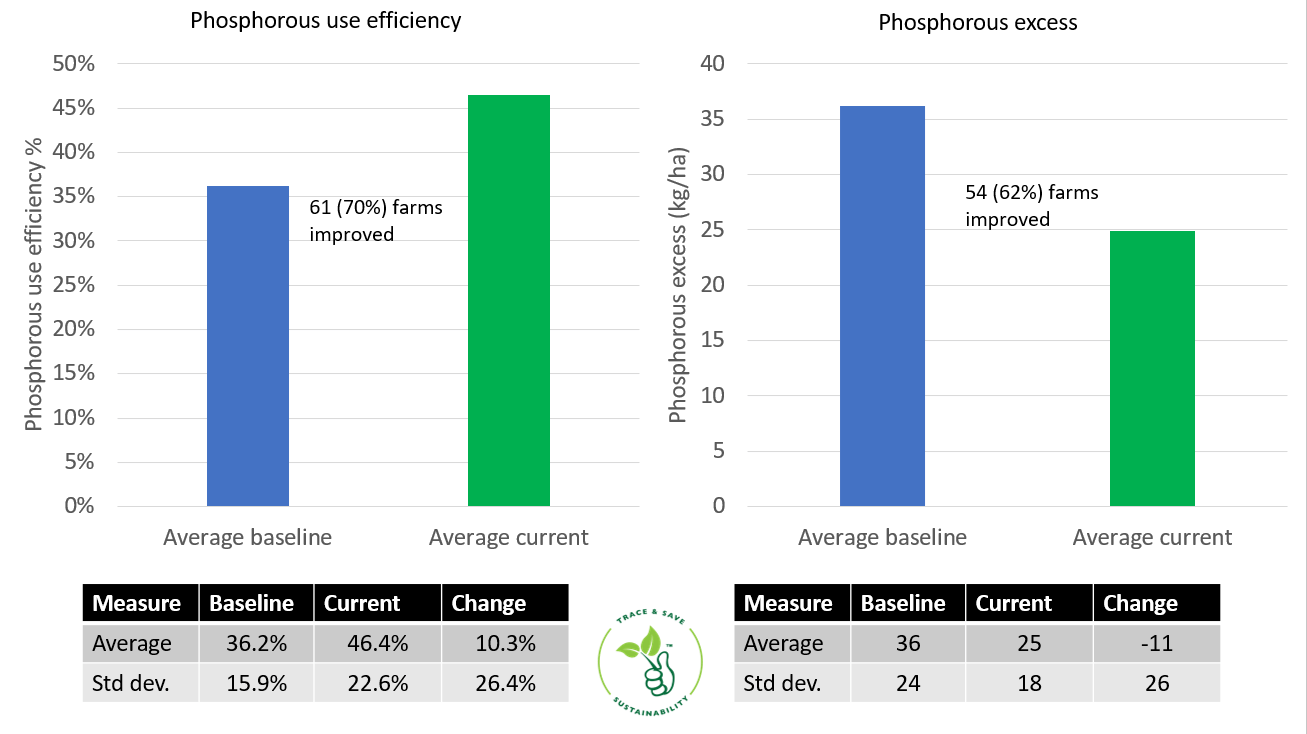
Figure 5: Average PUE and P excess for baseline and current years
Figure 5 shows that PUE and P excess have also both improved, although on slightly fewer farms – 70% and 62% of farms respectively. These values have improved by 10.3% and -11 kg excess P/ha, which are good improvements.
The improvements in N and P efficiency are especially notable since the previous assessment done on 45 farms had shown the Nutrient score to be the only score that had not improved at that stage. It is encouraging to see that this trend has been reversed and that great progress has been made with regards to nutrient management on these farms.
Conclusion
It is impressive to see that Trace & Save farmers have been able to improve on indicators in all four aspects of the SWAN system and that for each indicator a good majority of farms have shown improvement. We credit these improvements to the hard work done by farmers to implement sustainability best-practices, and encourage farmers to continue pursuing improved sustainability in the future.
Reference
- Rantoa, N. R. (2009). Estimating organic carbon stocks in South African soils. A dissertation submitted in accordance with the requirements for the Magister Scientiae Agriculturae degree in Soil Science in the Department of Soil, Crop and Climate Sciences, Faculty of Natural Sciences, University of the Free State, Bloemfontein.
- Du Preez, C. C., Van Huyssteen, C. W., & Mnkeni, P. N. (2011). Land use and soil organic matter in South Africa 2: A review on the influence of arable crop production. South African Journal of Science, 107(5), 1-8.
- A carbon footprint assessment for pasture-based dairy farming systems in South Africa - 2024-02-07
- What progress have farms participating with Trace & Save made over the past 10 years? - 2023-09-06
- Carbon footprint reduction over time: Lessons from pasture-based dairy farms in South Africa - 2023-09-04

