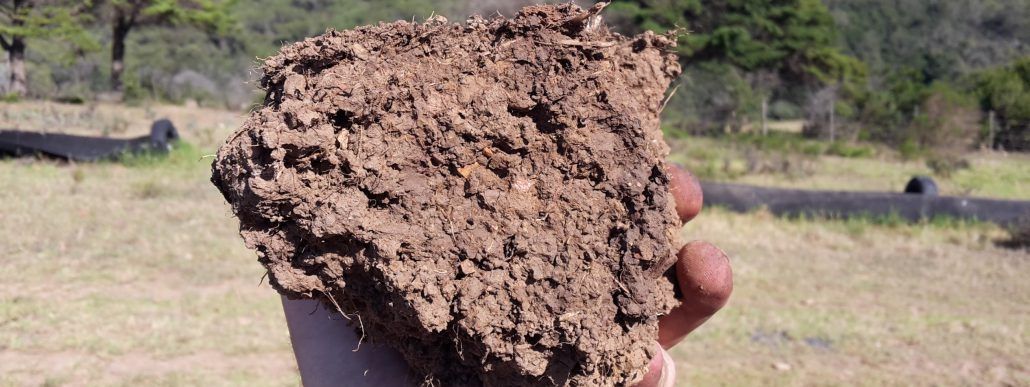
Active carbon (also known as labile carbon) is the part of soil organic matter that is readily available as an energy source for soil life. It is a very good indicator of soil health, responding much faster to changes in management practices than most other indicators. Active carbon levels have been found to be closely related to soil structure and biological activity indicators1,2.
Total carbon (TC) and active carbon levels (AC) in the soil are influenced by soil type. The levels of both TC and AC are expected to be higher in soils with higher clay content (i.e. clay > carbon levels than silt > carbon levels than sand textured soils). Good levels of AC in soils are greater than 700 mg/kg in sandy, 750 mg/kg in silt and 1000 mg/kg in clayey soils1.
We started testing soils for AC in 2013, and have noticed some interesting results, especially with regards to variations in soil type and management practices of farms where the research has been carried out. The data in this case study comes from three different dairy farms in the Eastern Cape, South Africa.
Farm 1 is in the Alexandria area. It is very close to the coast, therefore the soil is very sandy, with very little or no clay or silt. The pastures are kikuyu dry lands, but receive large amounts of moisture from rain and mist coming from the nearby ocean. These pastures have been established for about 25 years (some are older than others). The farmer has practiced no-tillage for at least the last 20 years.
Farm 2 is in the Tsitsikamma area. The soil is predominantly sandy, but with some silt and clay, especially below 45 cm depth in the soil profile. The pastures are irrigated kikuyu, ryegrass, clover mixtures, with some radish and turnips having been planted in the last 3 years, on certain camps. The farmer has practiced minimum-tillage for the last 18 years.
Farm 3 is in the Humansdorp area, the soil is predominantly silt based (i.e. loamy soil), but with some areas with large amounts of clay. The pastures are irrigated kikuyu, ryegrass, clover mixtures, with some radish, turnips and mustard having been planted in certain camps in the last 3 years. The farmer has practiced minimum-tillage for the last 10 years.
These three farms are diverse in their locations and soil types, but all have implemented sustainable agriculture management practices for at least the past 4 years. This allows for us to gain some insight as to the positive affect of these management practices on soil AC levels. There has been very little research done on AC in South Africa, as it has only become prevalent in recent years, therefore we will have to observe over years ahead the change in AC according to various management practices. For now we can gain insight from the current data relative to the research done by Cornell University, and the levels which they have found to be good in various soil types.
The AC results below are based on analyses of composite soil samples taken from the top 15 cm of the soil profile. The TC and Porosity results are taken from a comprehensive sampling process which extrapolates soil core sample data to spectrophotometer readings taken every 0.3 ha throughout each camp.
Active carbon
Porosity
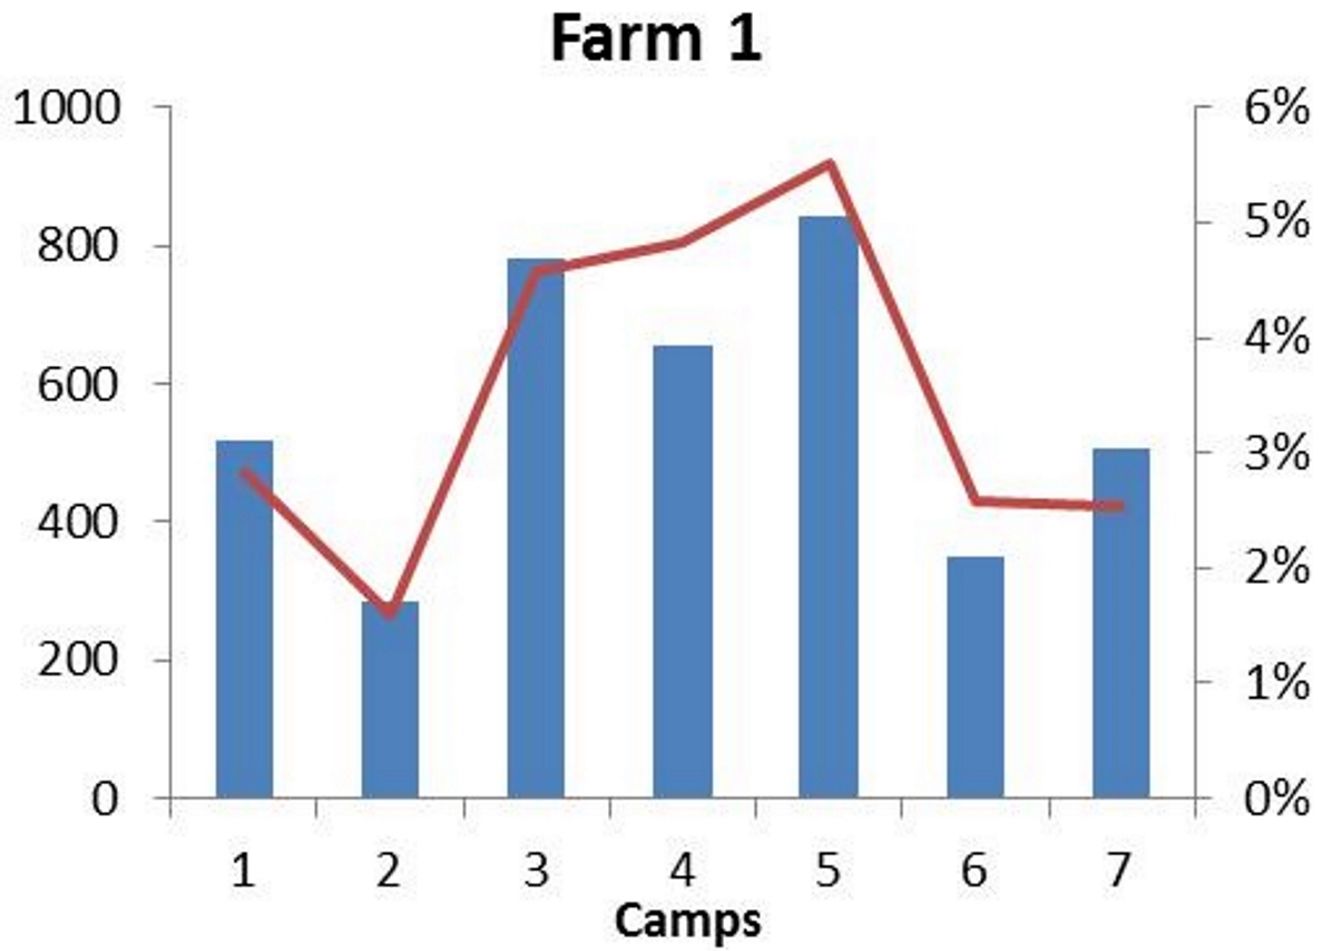
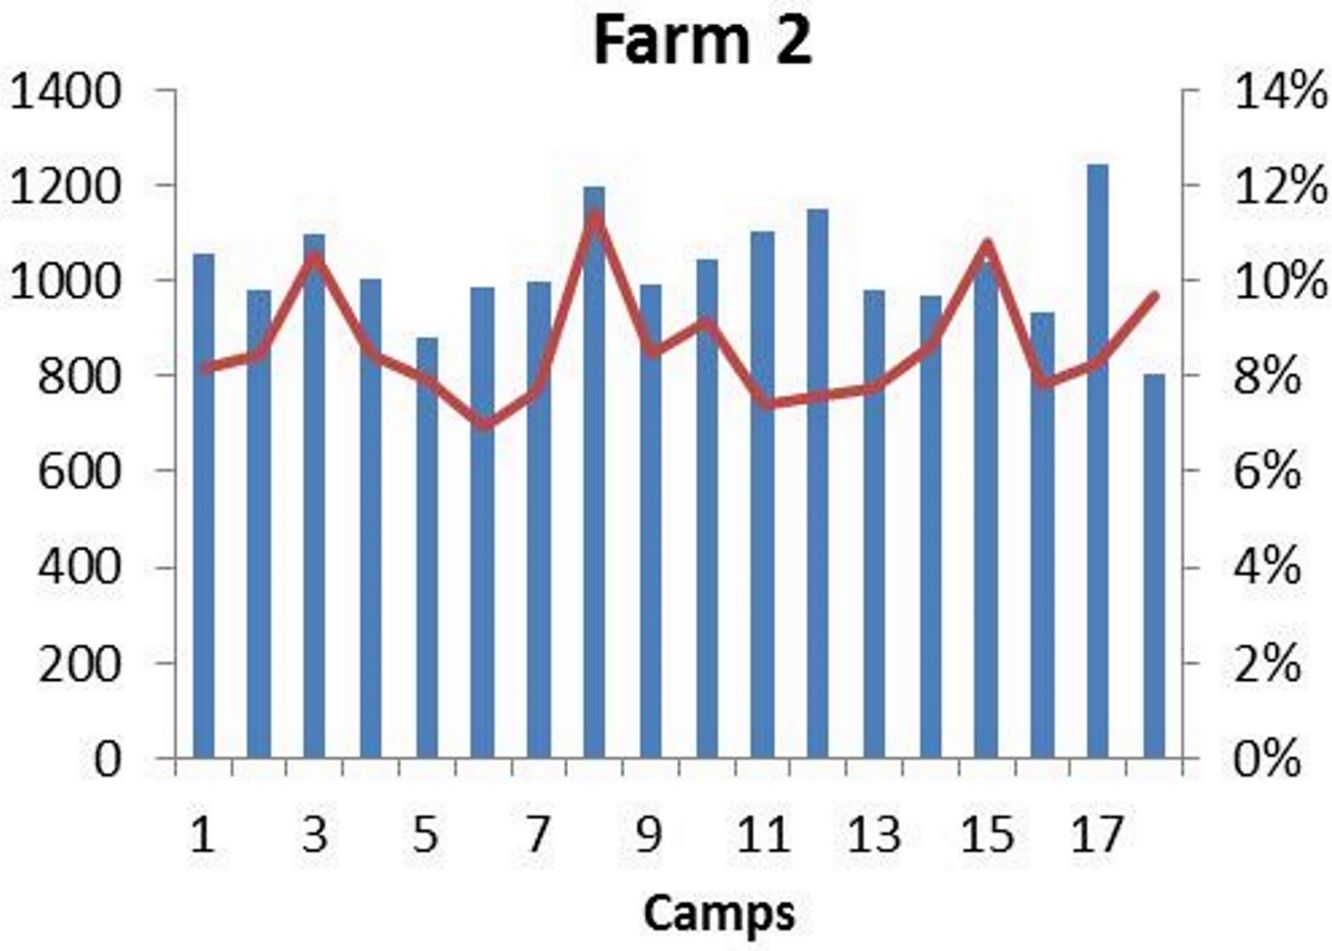
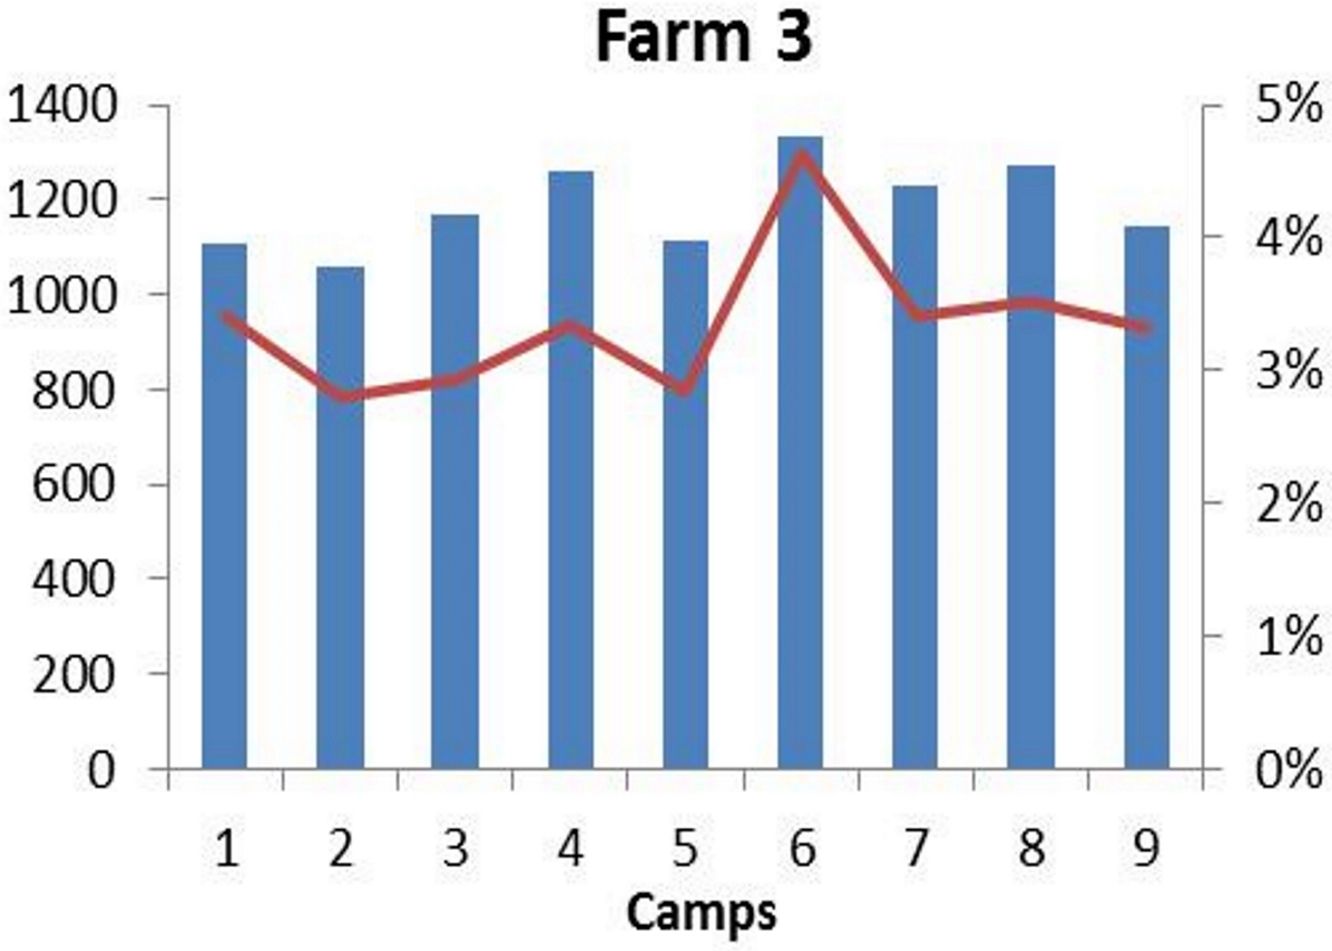
The graphs above show that the AC on farm 1 (average: 563 mg/kg) is below the optimum of 700 mg/kg, and is not as high as farm 2 (average: 1026.2 mg/kg) or farm 3 (average: 1187.6 mg/kg). This is to be expected though due to the very sandy nature of the soil. We were actually surprised as to the high levels for such sandy soil, especially in camps 3 and 5 which are above the optimum level. Farms 2 and 3 both have above optimum levels of AC, which is a great indication of healthy soils and good management practices.
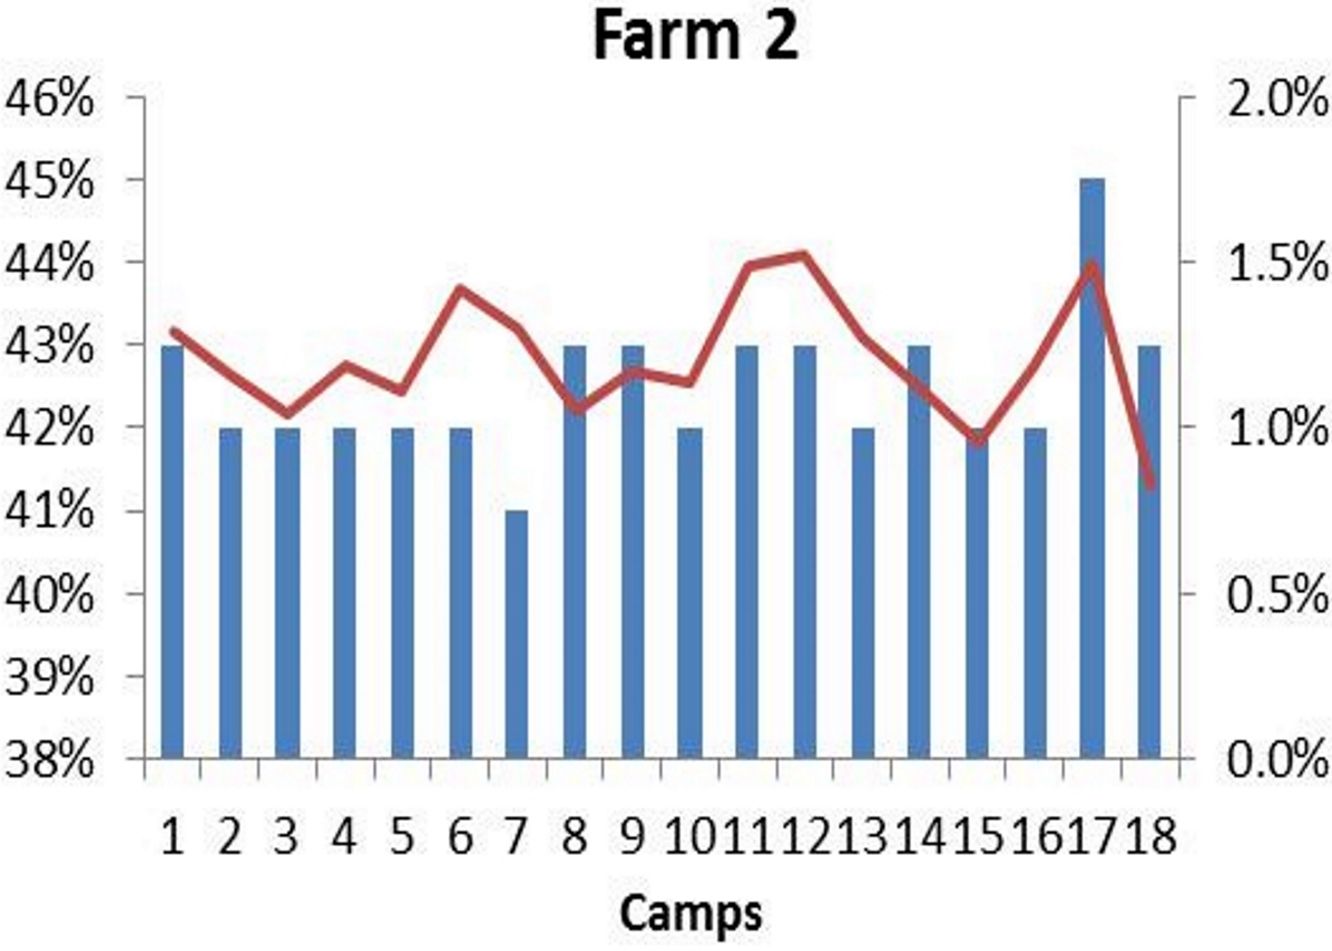
The TC levels in the soil are not necessarily what would be expected with the varying soil types (averages: Farm 1 – 1.7%; Farm 2 – 1.2%; Farm 3 – 3.6%), as you would expect the sandy soils of Farm 1 to have lower TC than Farm 2. The age of the pastures, along with the length of time that the farmer has practiced no-tillage, and the high amounts of chicken manure that the farmer has applied between 20 and 30 years ago would have played a significant role in the high TC levels. Due to the silt and clayey texture of the soils, as well as good management practices which facilitate increase of Carbon in the soil that have been implemented on that farm, it is as expected that Farm 3 would have the highest TC levels.
Another interesting aspect to compare is AC as a percentage of TC (averages: Farm 1 – 3.5%; Farm 2 – 8.6%; Farm 3 – 3.4%). The goal is to have 5% AC of TC3. It is interesting that although Farm 2 does not have very high TC, it has very high AC values. This could be taken as an indication of more recent improvements in management practices that have led to healthy soil, especially with regards to soil life, but these practices are still in the process of building TC in the soil.
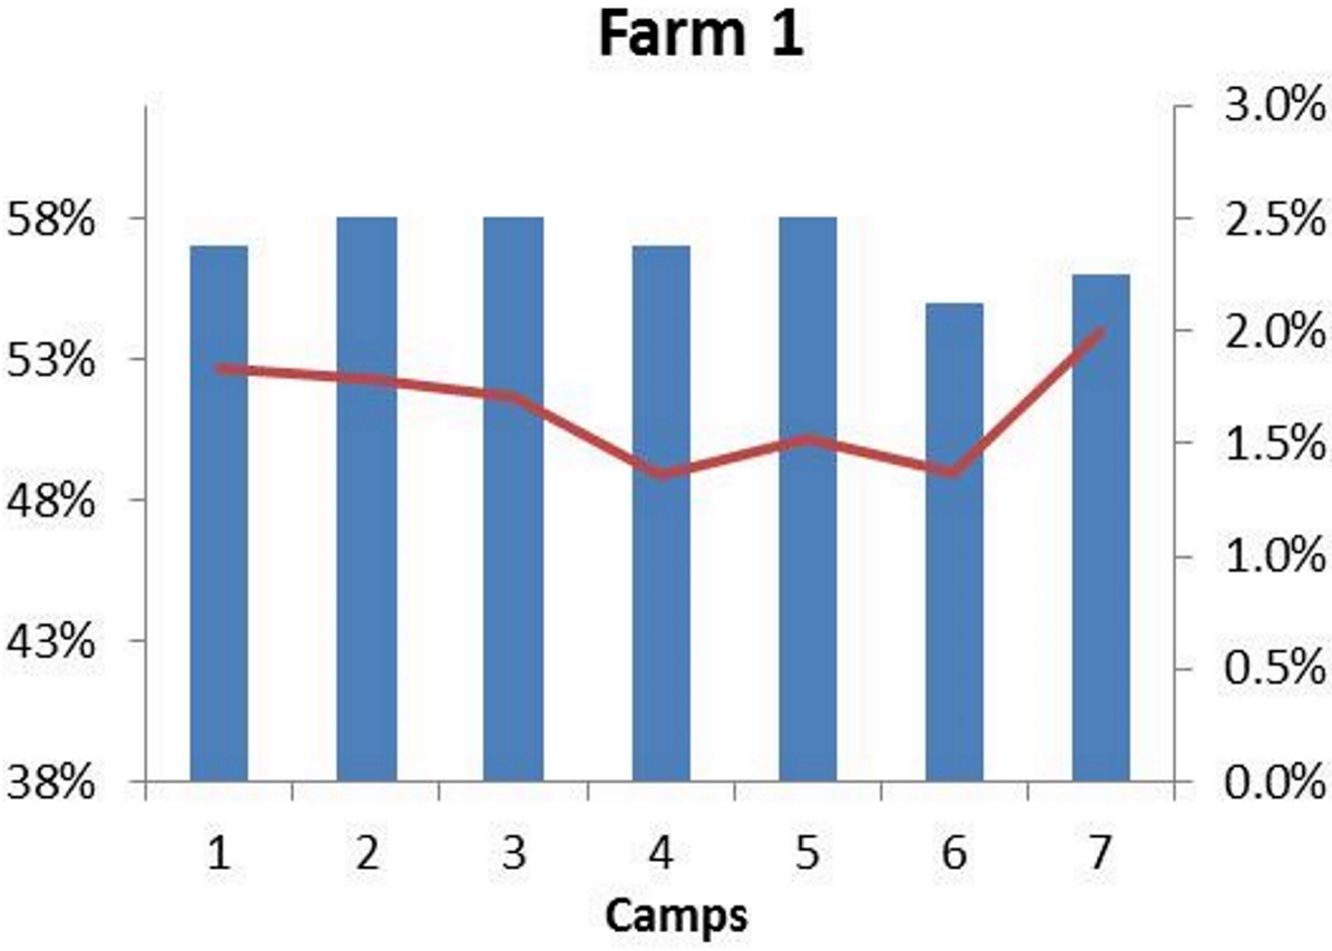
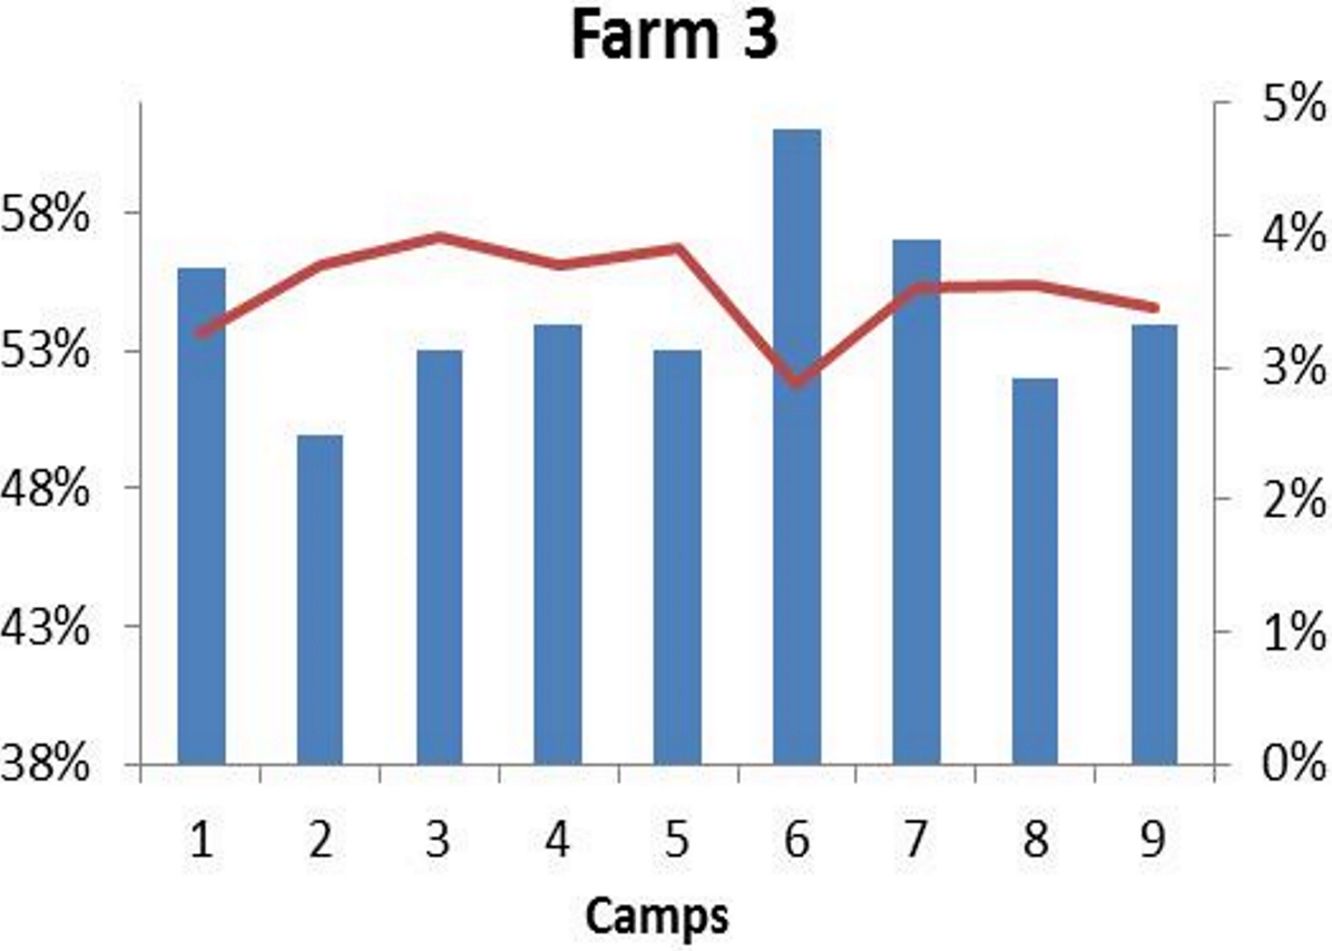
TC in the soil is related to soil structure, more Carbon in the soil results in better structure. Porosity is a measure and indicator of soil structure, as it is the amount of pore (open) space there is in the soil profile that is able to be filled with air and water. An increase in Carbon, which improves the structure, will result in a better porosity. The porosity also relates to AC in that, a soil with better porosity and structure will form a better habitat in which soil life can thrive (soil life needs air and water), therefore facilitating more conversion of Carbon to AC. The graphs above show the porosities for the 3 farms (averages: Farm 1 – 57%; Farm 2 – 43%; Farm 3 – 54%). It is quite surprising that the sandiest soil has the highest porosity, but when the Carbon levels are taken into account, along with the management practices on the farm over time, then the results are not so surprising. The porosity results for Farm 2 show once again the opportunity for improvement of soil structure, especially through building Carbon.
We look forward to observing the changes in AC, TC and Porosity over time on these three farms, along with many other farms, which will give us even greater insight as to the importance and relevance of these indicators of soil health.
References:
- Cornell Soil Health Manual (http://soilhealth.cals.cornell.edu/extension/manual.htm)
- Labile Carbon Fact Sheet (https://s3.amazonaws.com/soilquality-production/fact_sheets/4/original/Biol_-_Labile_Carbon.pdf)
- Sherrod LA, Peterson GA, Westfall DG, Ahunja LR. 2005. Soil Organic Carbon Pools after 12 Years in No-Till Dryland Agroecosystems. Soil Science Society of America Journal 69(5): 1600-1608.
- A carbon footprint assessment for pasture-based dairy farming systems in South Africa - 2024-02-07
- What progress have farms participating with Trace & Save made over the past 10 years? - 2023-09-06
- Carbon footprint reduction over time: Lessons from pasture-based dairy farms in South Africa - 2023-09-04

