Sustainable agriculture often suffers from a case of lots of theory but not much relevant data to back up how it has worked practically. Trace & Save would like to change that by sharing case studies of how farms have become more sustainable over time through the implementation of good management practices. The farms included in these case studies are pasture-based dairy farms in South Africa.
Note: This is a follow-on to a previous Case study: Improving nitrogen fertiliser efficiency. More context is provided in that case study, including information on the farms included. It is advisable to first read that case study before proceeding to this one.
Introduction
One of the pillars of sustainability is economic viability, with the goal of long-term profitability. The biggest variable cost on pasture-based dairy farms is bought-in feed. One of the ways to reduce this cost is to grow more and better-quality pasture, reducing the need for bought-in feed.
This is all good and well, but the response to this by farmers is often to use more fertiliser. The previous case-study (Improving nitrogen fertiliser efficiency) already discussed the efficiency of converting nitrogen into pasture. In this case study I want to show how the overall nitrogen, phosphorous and potassium fertiliser costs have reduced over time. It is obvious from the nitrogen efficiency case study that the cost of nitrogen should decrease, but it is interesting to see how much cheaper it has become to produce a ton of pasture on these farms over the past four years.
Case study area
As mentioned, this case study is based on five farms which Trace & Save works with and the data is from the past four years. The Rand values of nutrients were based on the average price of urea, MAP, KCl and Chicken litter from the past four years. This equated to R11.56/kg of chemical nitrogen, R27.25/kg of chemical phosphorous, R12.54/kg of chemical potassium and R10.90/kg of organic N, P and K.
Results
Fertiliser costs
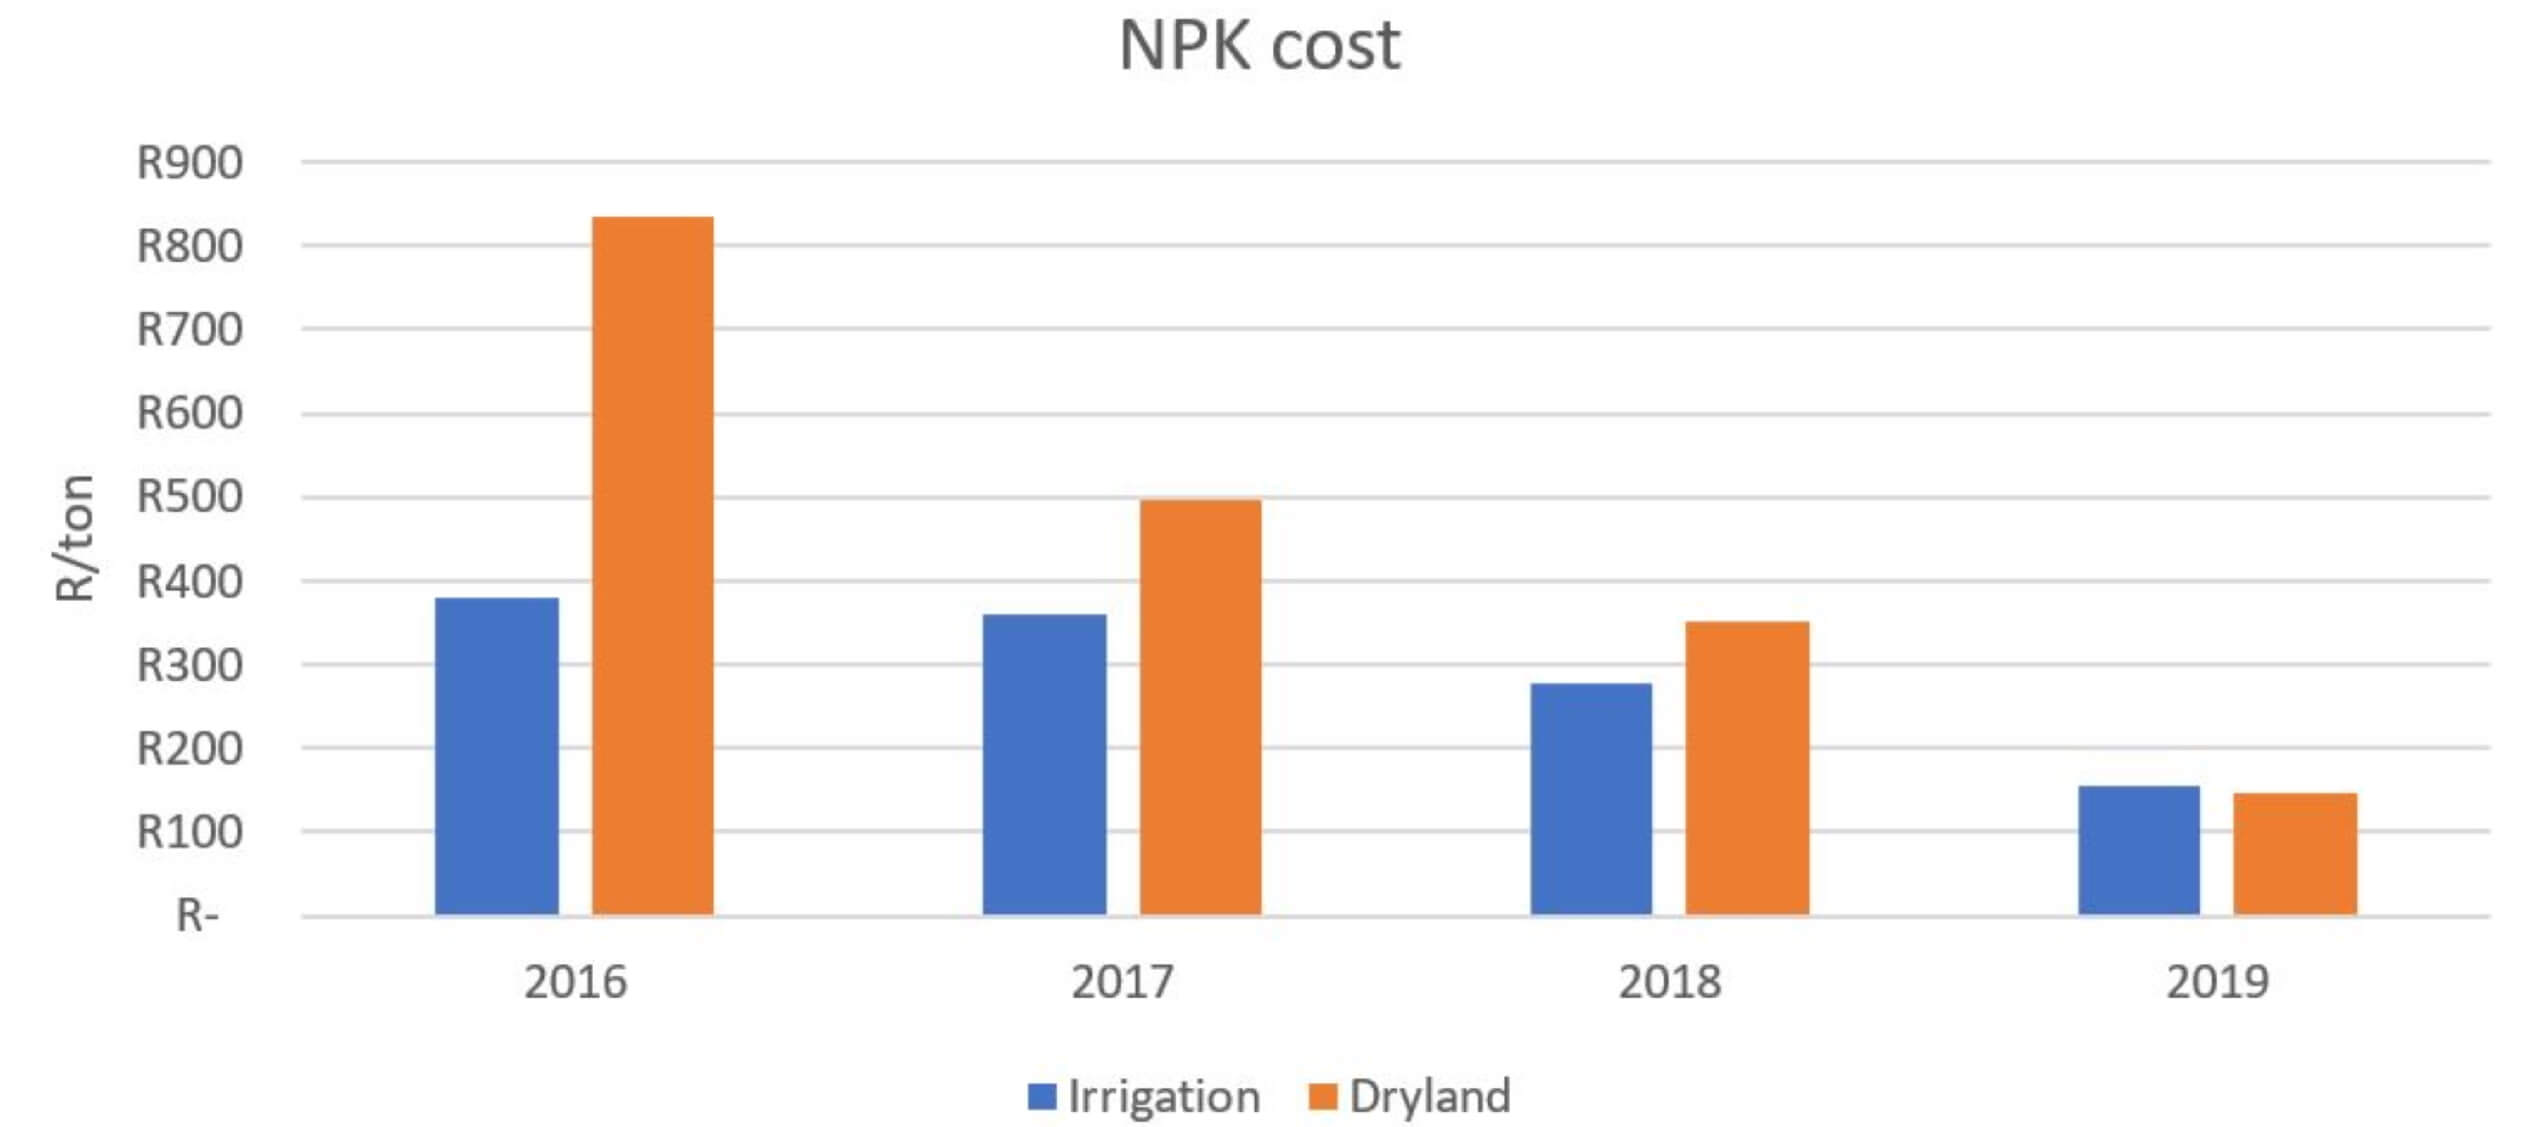
There has been a large reduction in fertiliser costs on these farms over the past four years. The most drastic reduction has been in the cost of dryland pasture. From the previous blog, the amount of dryland pasture grown over the past four years increased from 8.2 tons/ha in 2016, to 9.3 tons/ha in 2017, 14.5 tons/ha in 2018 and 16.4 tons/ha in 2019. This increase in pasture production was not achieved through applying more fertiliser.
Irrigated pastures have become 60% cheaper to produce, dropping from R379/ton in 2016 to R155/ton in 2019. This is a huge saving for these farmers. As with the drylands, this reduction in cost was also associated with increased pasture production using less fertiliser.
Figure 1: The average sum of NPK fertiliser cost per ton of pasture produced over the past four years
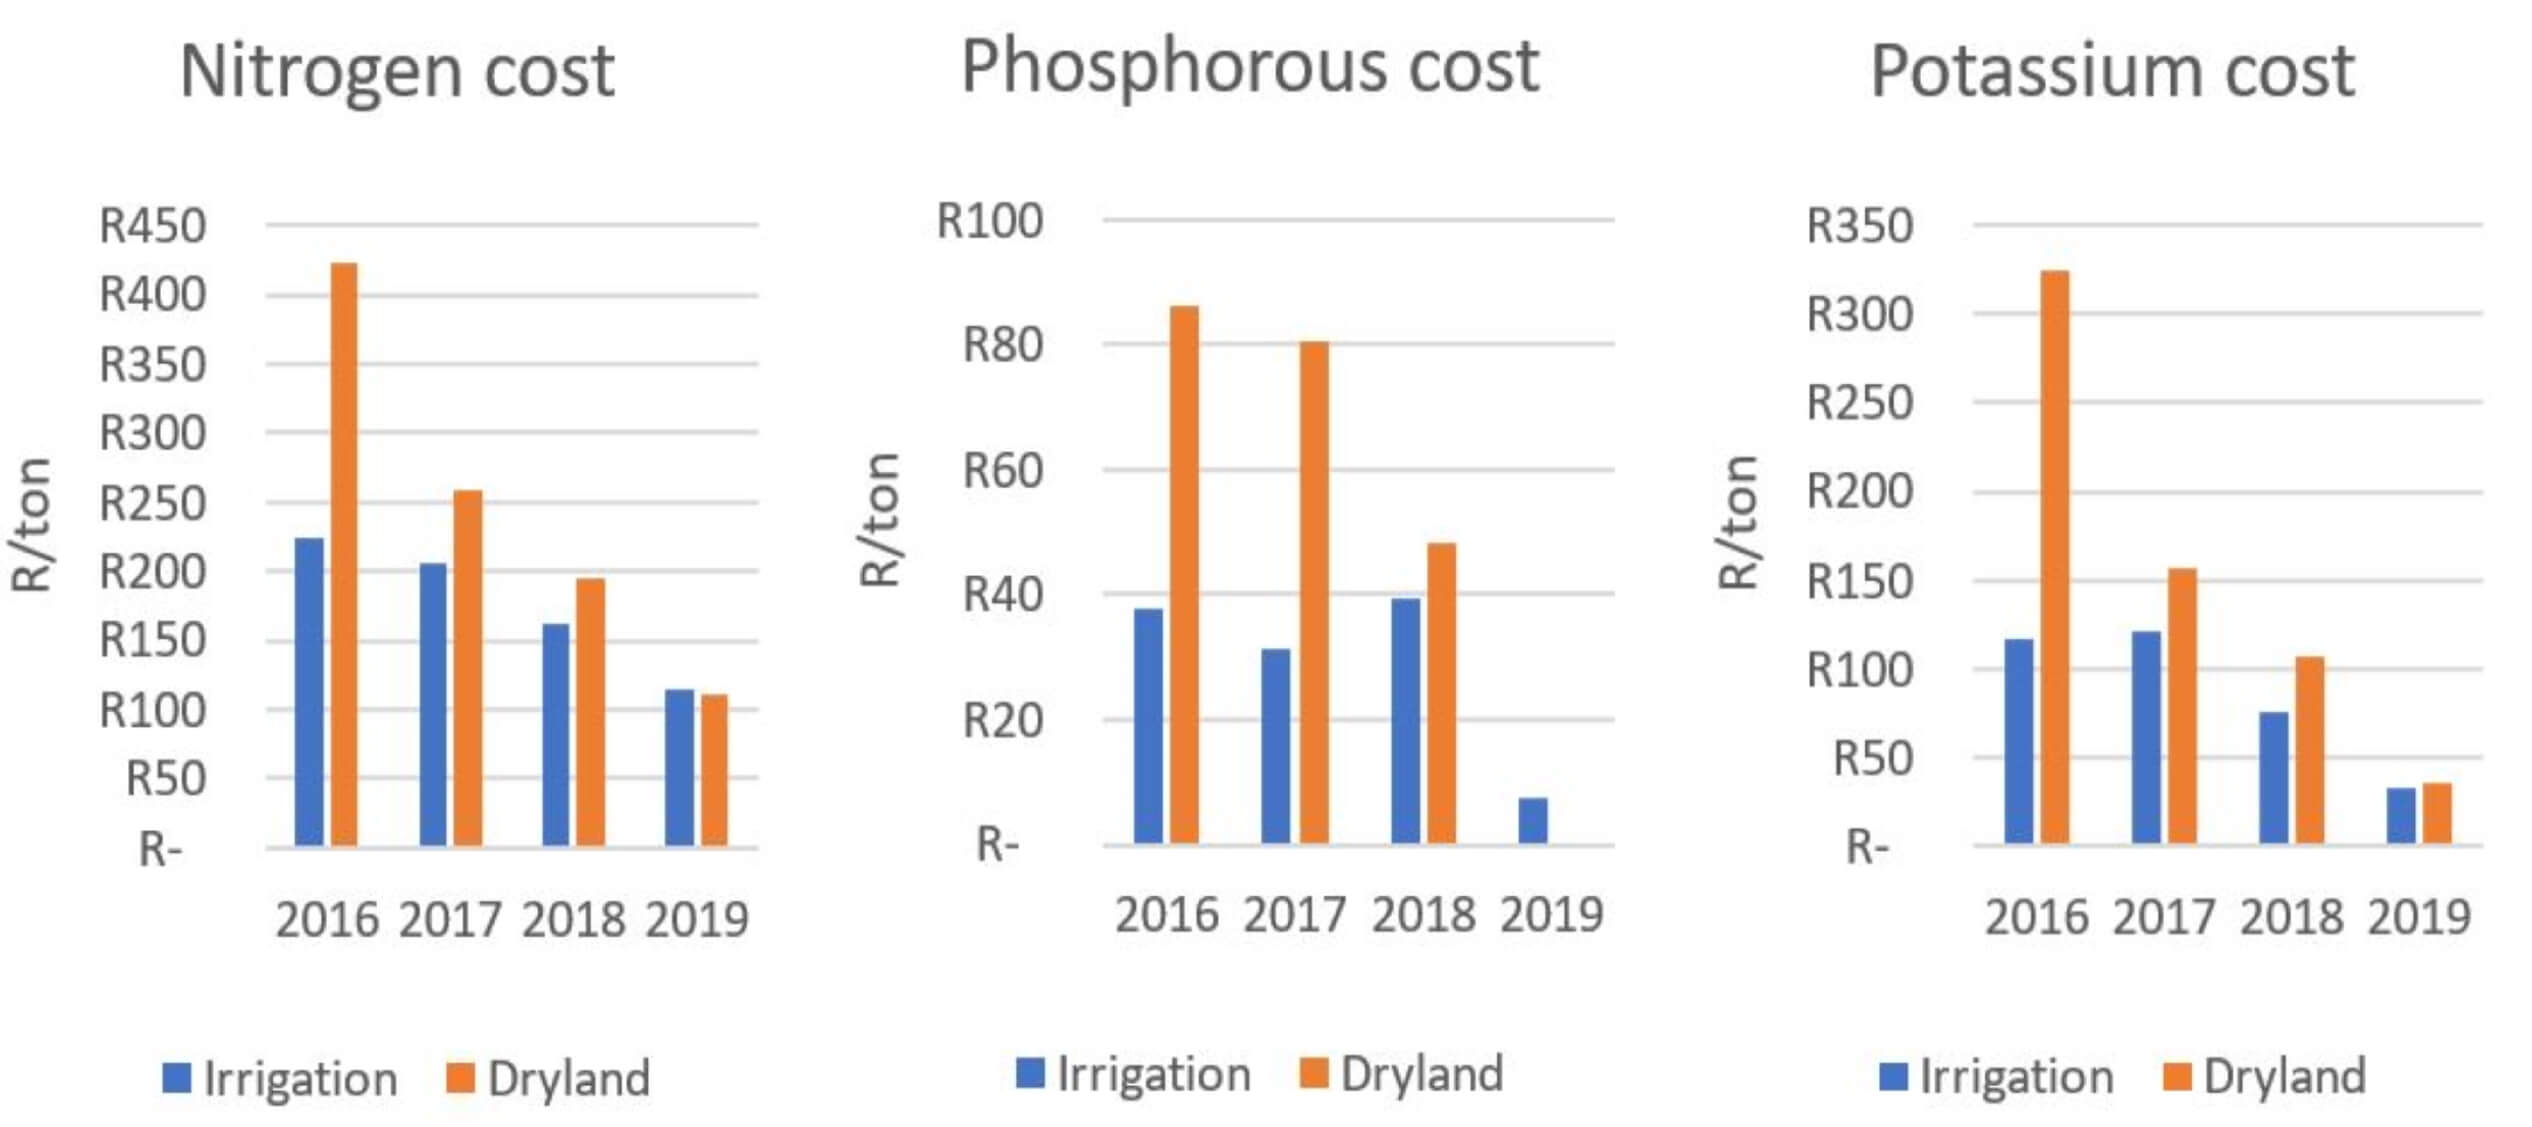
Nitrogen has been focussed on in the previous case study, so Figure 2 shows the split in cost reduction between N, P and K. On drylands the cost of P has reduced from R86/ton in 2016 to R0/ton in 2019. Under irrigation the P fertiliser cost was R38/ton in 2016 vs only R8/ton in 2019. Potassium has followed the same trend, with a 72% reduction on irrigated pastures and an 89% reduction in cost per ton on dryland pastures between 2016 and 2019.
Figure 2: The average individual nitrogen, phosphorous and potassium cost per ton of pasture produced over the past four years
Soil fertility
One of the main influences on the reduction in phosphorous and potassium costs are simply that the farmers have built the soil levels to optimum. As was seen in the previous case study, there has been a significant reduction in organic fertiliser over the past four years on these farms. This has been mainly due to not wanting P and K levels to become excessive. I find it completely irresponsible that there are still people recommending phosphorous fertiliser once soil levels have become beyond optimal.
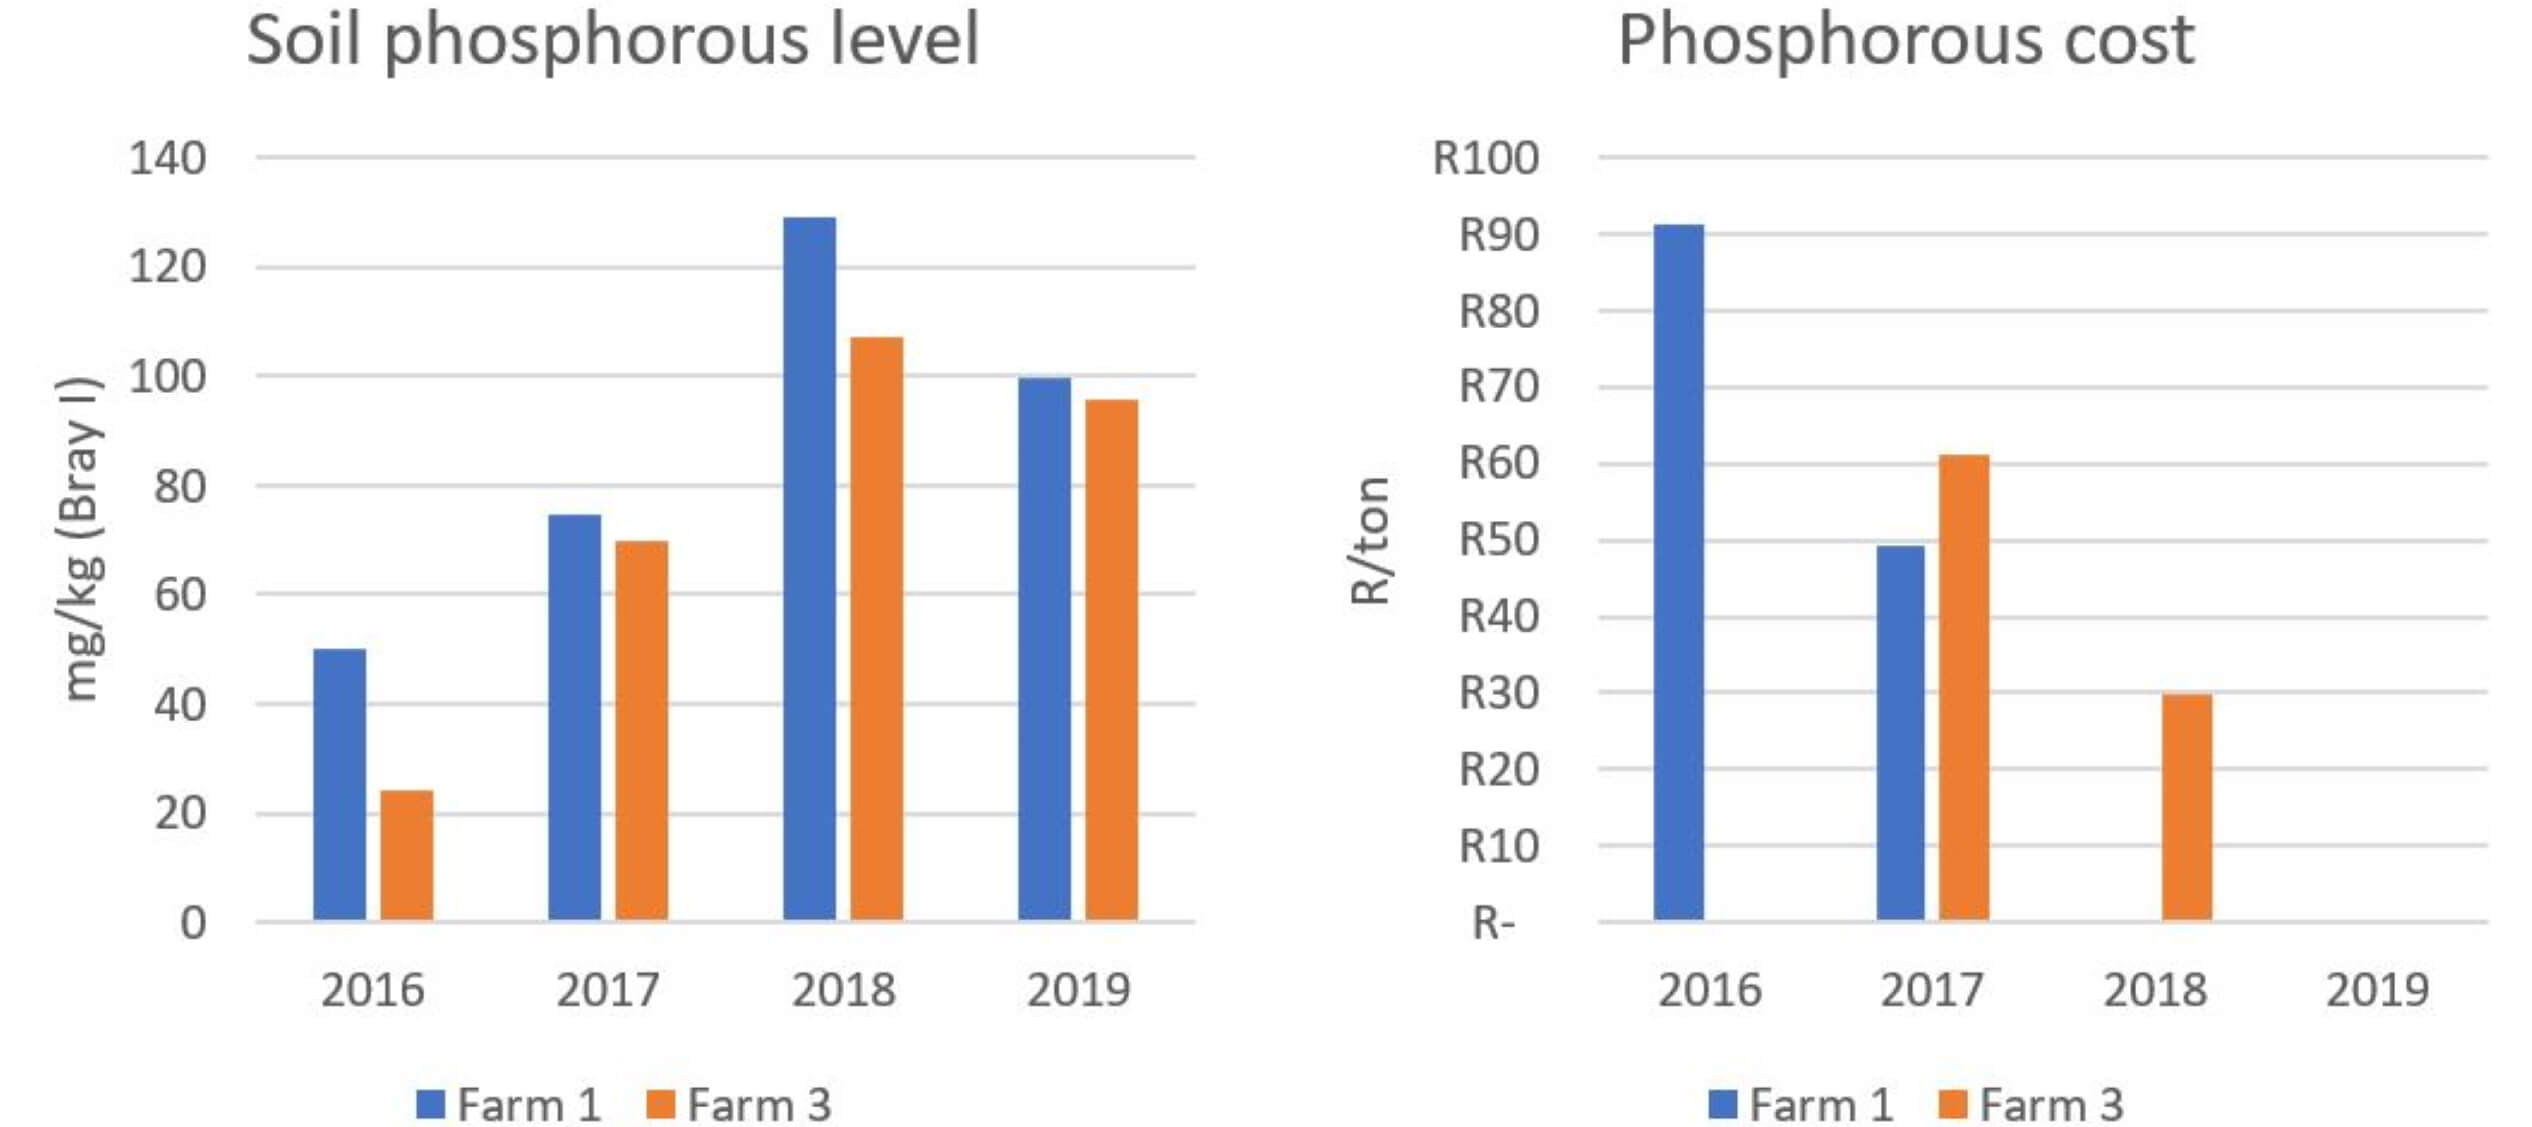
Figure 3 shows the increase in soil P levels, with the corresponding decrease in P fertiliser cost. Optimal P Bray I levels are 30-50 mg/kg, with anything above 100 mg/kg becoming excessive. That is why the decrease in P levels from 2018 to 2019 was positive. Farm 1 has been using no P fertiliser for two years, whereas Farm 3 only stopped using P fertiliser in 2019.
Figure 3: Soil phosphorous levels and the corresponding cost of phosphorous fertiliser on two of the farms included in the case study
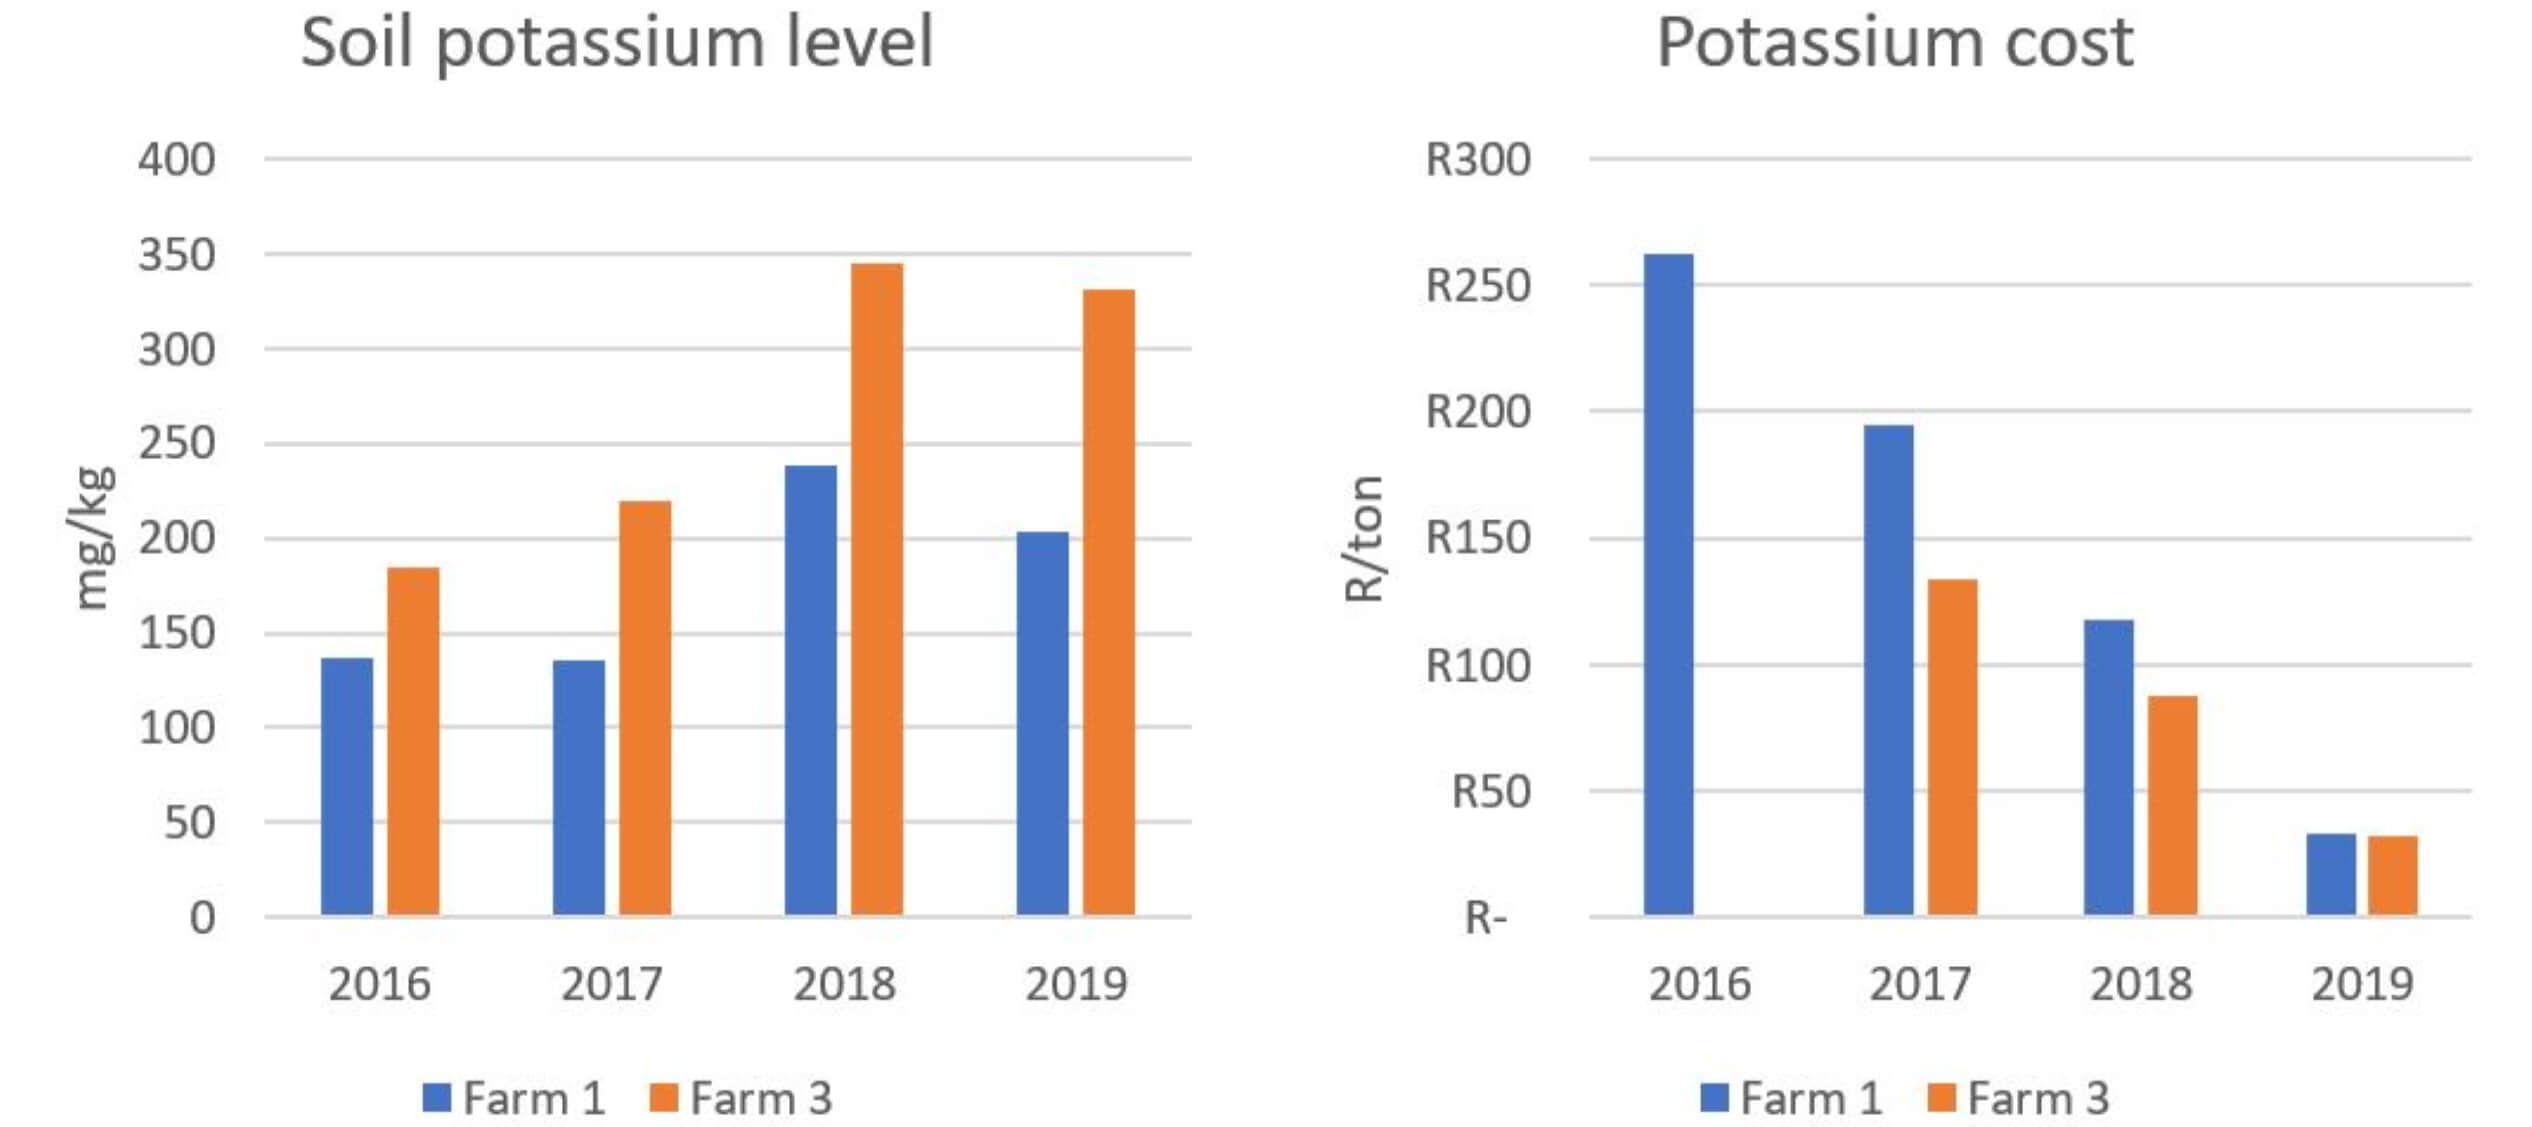
Figure 4 shows the steady increase in soil potassium levels on the two farms. Both these farms are in the Tsitsikamma and have sandy soils. One of the challenges with sandy soils is that they struggle to hang on to K – it leaches very easily. Ideal soil K levels are greater than 180 mg/kg. These farms have managed to build their K levels by increasing the soil carbon, which increases the nutrient holding capacity of the soil. This has led to the opportunity of reducing the cost of potassium fertiliser.
Figure 4: Soil potassium levels and the corresponding cost of potassium fertiliser on two of the farms included in the case study
Discussion
I am sure every pasture farmer has the goal of reducing their spending on fertiliser. Here are five farms that have done so significantly. As discussed in the previous blog, this has been done mainly through improved soil health and good grazing management. Another factor has been the strategic use of effluent, to recycle these nutrients back onto the pastures. Interestingly many farmers are having to figure out how to get their effluent to new areas on the farm, due to the build-up of excessive levels of phosphorous, potassium, magnesium and sodium, even on sandy soils.
The take-away challenge is for farmers to assess whether their fertiliser costs are decreasing per pasture produced, i.e. are you growing cheaper pastures? The values used for nutrients in this case study was standardised to reflect actual change. In reality, the values in recent years are slightly higher due to the increased cost of fertiliser.
Will you be caught out by the cost-price squeeze of increased costs, similar milk price, or will you figure out how to grow cheaper pastures, like these farmers have.
Further reading
Improving feed energy utlisation: Six years of data in the Tsitsikamma
- A carbon footprint assessment for pasture-based dairy farming systems in South Africa - 2024-02-07
- What progress have farms participating with Trace & Save made over the past 10 years? - 2023-09-06
- Carbon footprint reduction over time: Lessons from pasture-based dairy farms in South Africa - 2023-09-04

