Not only farmers have a role to play in sustainable food production.
Buy sustainable.
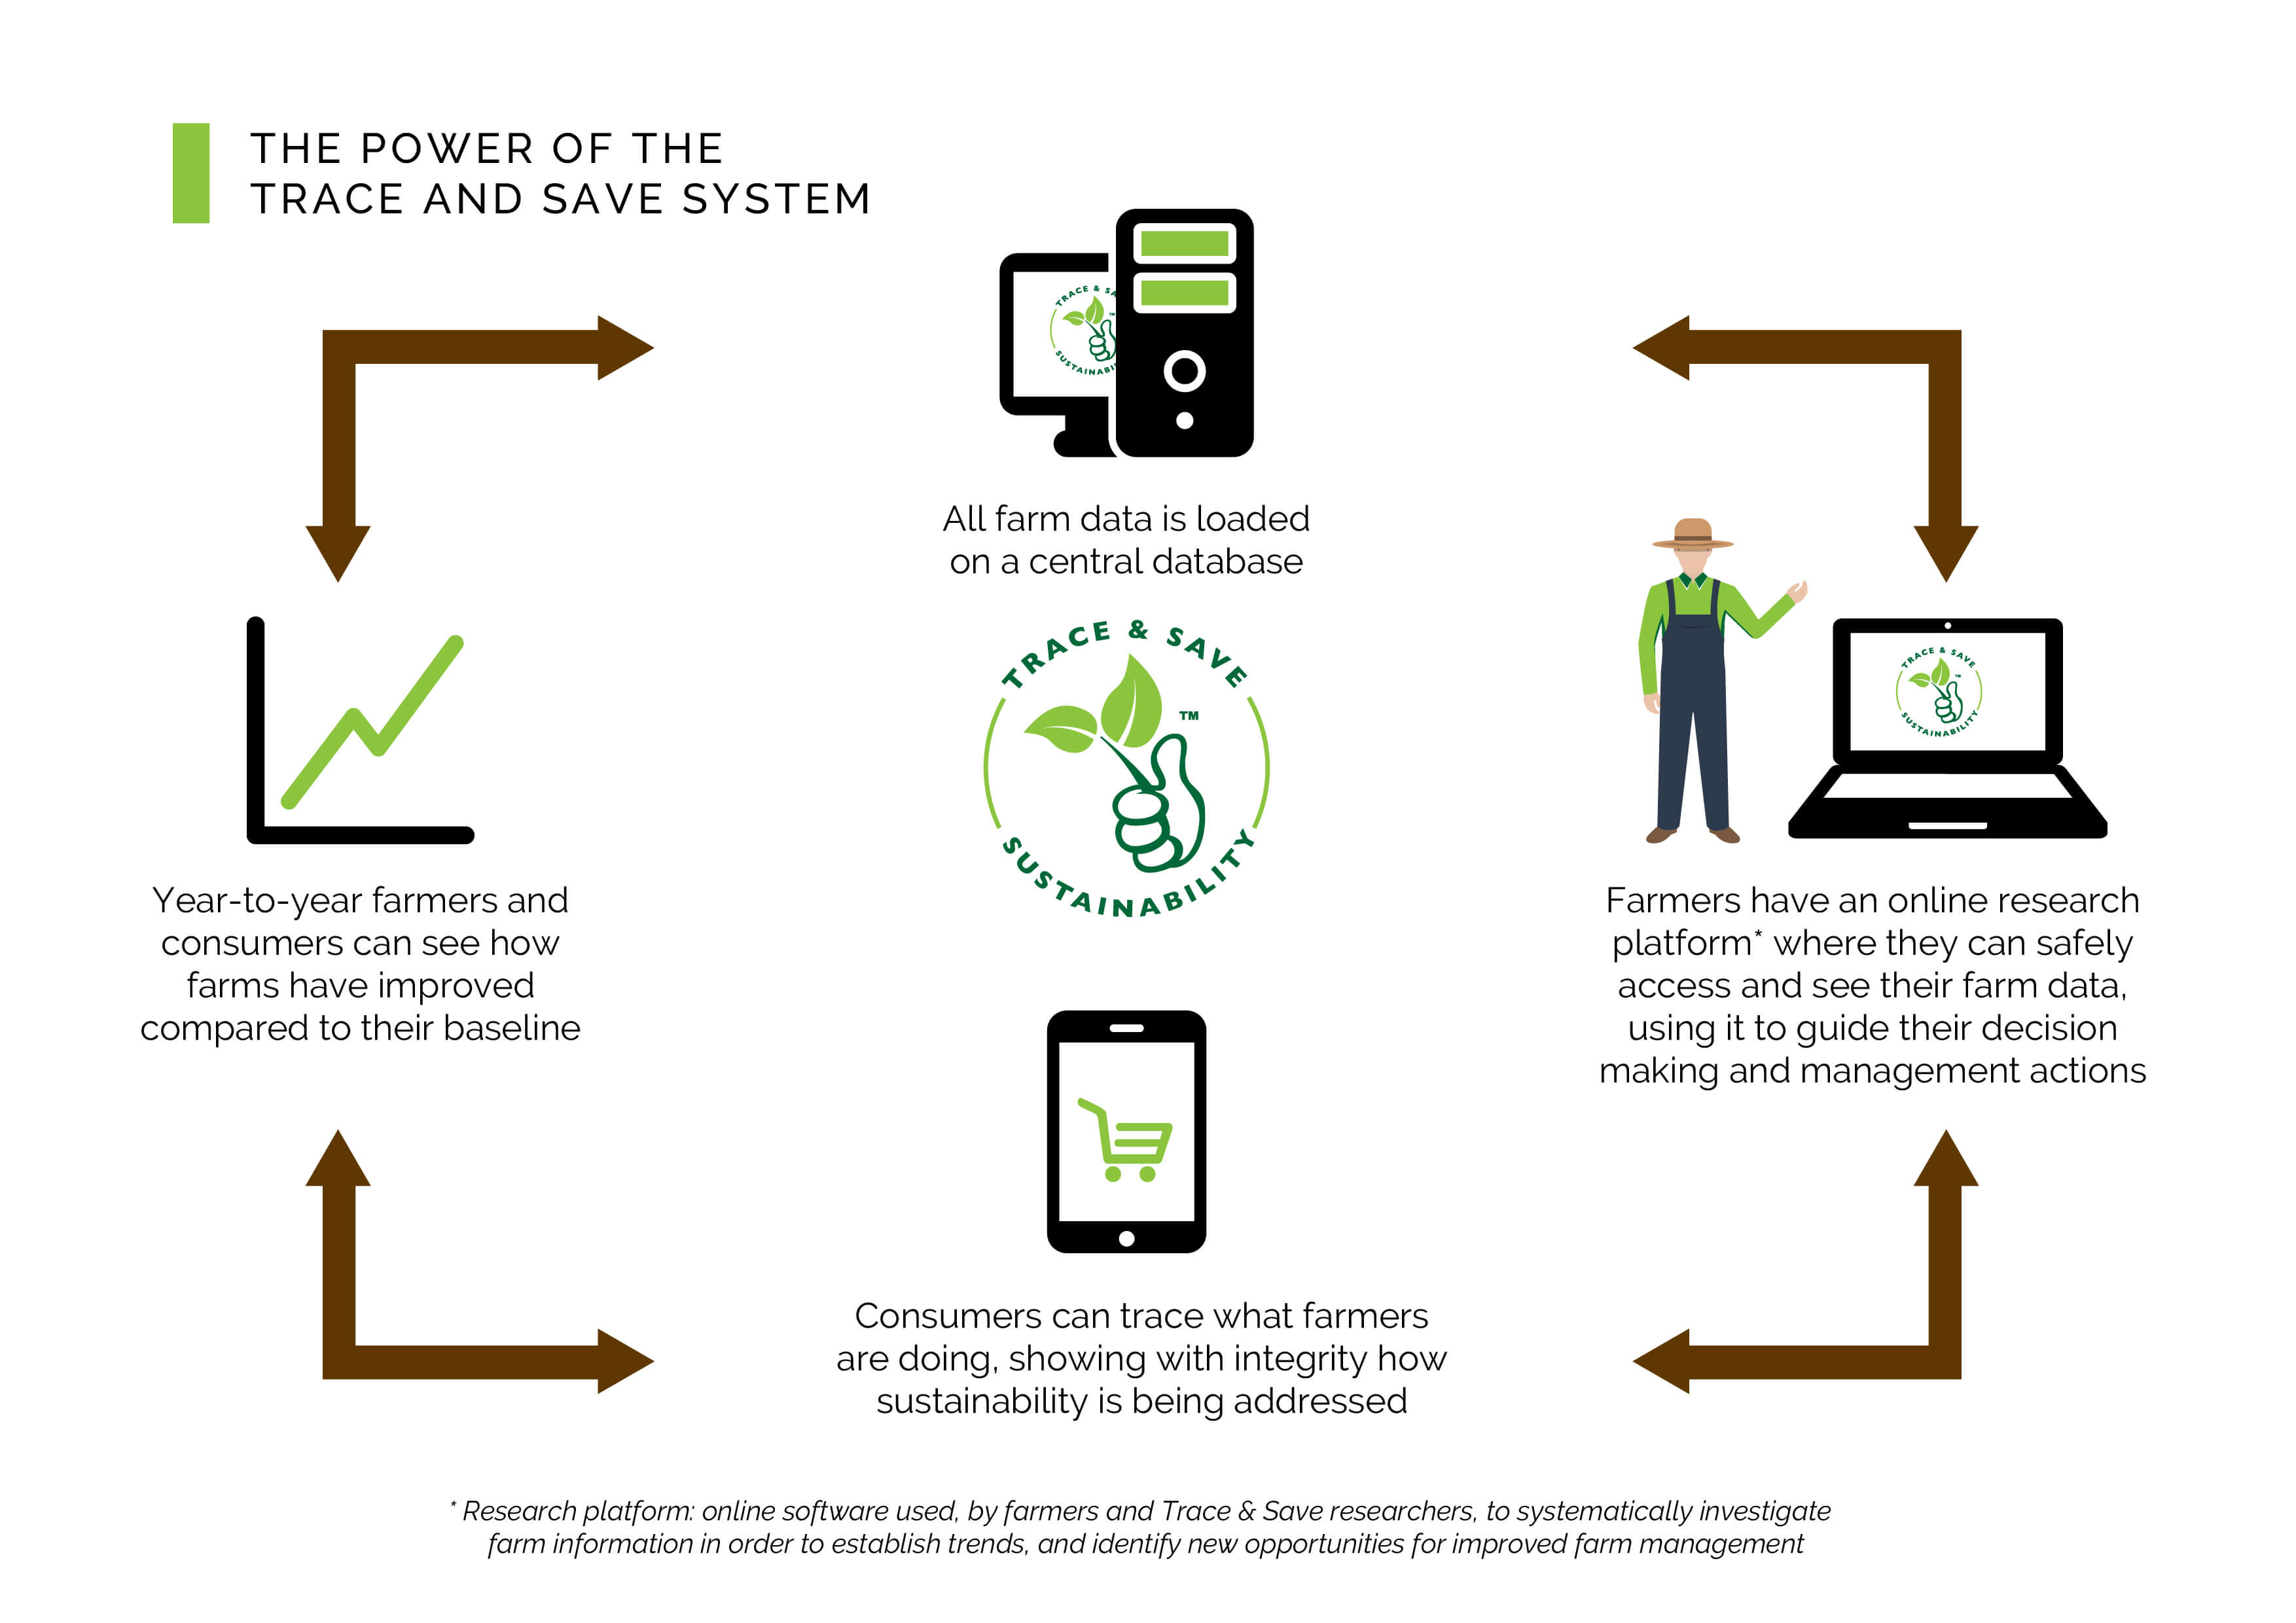
That is why Trace & Save believes that consumers should be able to find out whether the food they buy is being produced sustainably. There are many claims to sustainability, but few have the evidence to back it up. Trace & Save is all about measured agricultural sustainability. The graphs below empower consumers to see whether farmers are improving or not with regards to sustainable farming.
This process of collecting data, and using it to show both farmers and consumers whether sustainability is actually being addressed, is why we believe the Trace & Save system has such great power.
The SWAN graphs display the average sustainability performance on participating farms over the time that these scores have been measured. The current score of participating farms is calculated each week, and updated on the graphs so that consumers can trace the sustainability performance of farms over time. Participating farmers can click on the SWAN link above to open the detailed farm reports for their farm.
The baseline is the original score given to a farm the first time the SWAN score is measured. The SWAN score is the current score of the participating farms. The difference between the baseline and current scores shows whether there have been improvements or not on the farms since the baseline was measured.
Click for more detailed graphs
NOTE:
-
- The large changes in the baseline and score at certain times are due to a change in the way the indexes are calculated.
-
- The drought conditions in the Eastern Cape during 2016, 2017 and 2018 have been very challenging for farmers, and have influenced the SWAN scores on some farms. This is not necessarily due to improper farm management, but is rather caused by the drought.


