Our passion
At Trace & Save we are passionate about three things: 1) measured agricultural sustainability; 2) sustainable, regenerative farming; 3) informed, responsible consumers. The way we practically implement our passion is by working with farmers. We assist them by using tools which we have developed that measure various indictors of sustainability on their farms.
These indicators/tools give farmers insight into how they can make their farms more sustainable. We work with them to develop and implement strategies to achieve this purpose. All the data we collect in this process is loaded onto our Trace & Save research database. This database forms a research platform for us, farmers and other researchers that we partner with (e.g. universities).
What this database also does is allows us to share with consumers what the trends are on the farms we work with. This links our passions of measured sustainability and informed consumers. In this blog I am going to share some of the data which comes from the sustainability scores we use to measure farm sustainability.
This data is from 45 of the farms (although not all the farms have complete analyses) that have been working with Trace & Save for more than two years. You can learn more about these scores, and monitor the progress of participating farms on our Buy Sustainable page.
SWAN score
The SWAN score is an overall indication of how well farms are performing with regards to sustainability. It is a combination of our Soil, Water, Atmosphere and Nutrient scores. It is therefore a holistic overview of each farm.
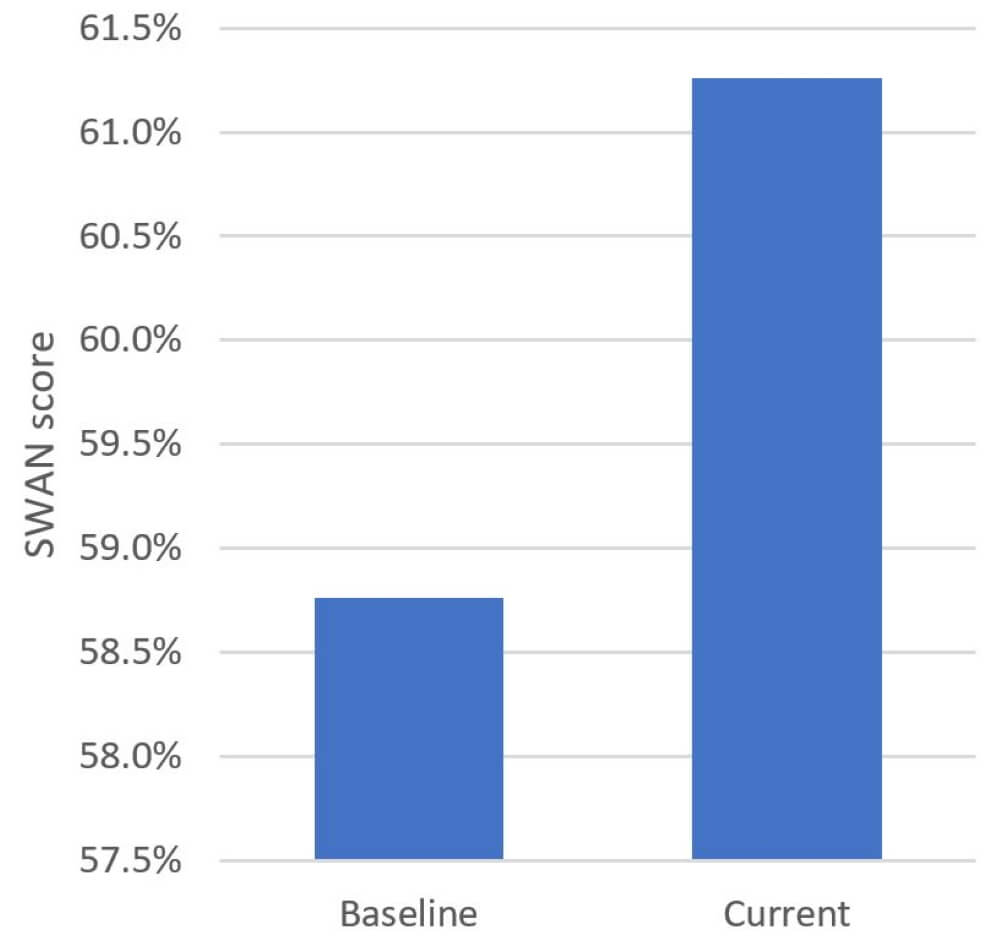
The first goal that we encourage our farmers to achieve is to improve their own farm. The first year that we work with a farm provides a baseline measure. The goal is to always be better than this. Secondly, we always encourage them to be better than the previous year. Figure 1 shows that the average SWAN score has improved from a baseline of 59% to a current score of 61%.
When looking into the data further, we can see that there are 27 (60%) of the farms which have improved their score. That means there are 18 (40%) farms which did not improve. Of these 18 farms, 9 had SWAN scores of greater than 61%. Therefore there are 9 farms which have regressed, and whose current SWAN score is below average. These are farms that we will work hard with to try and bring improvement. The rest of the farms just need to keep up the good work and keep pushing for improvement.
Figure 1: Baseline versus current SWAN score on 45 Trace & Save farms
Soil score
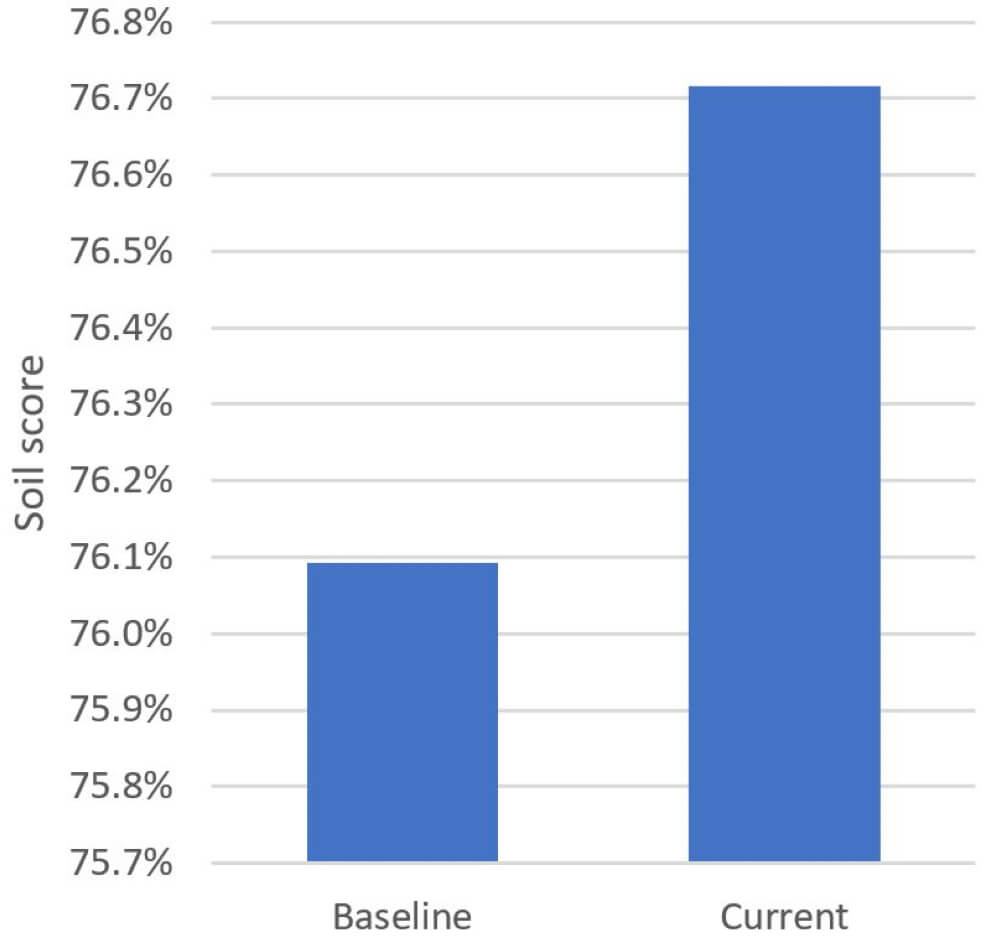
Figure 2: Baseline versus current Soil score on 45 Trace & Save farms
The soil score gives an indication of how healthy a farms soil is. Soil takes the most effort from a farmer to improve. It therefore takes the longest to change. Soil health is also susceptible to drought conditions, which is the main reason why many of our farm’s soil have regressed.
There has not been much change to the soil scores on average. The average baseline for the 45 farms is 76.1%, and the current average soil score is 76.7%. There has been improvement on 23 farms, whereas 22 farms have regressed. Only 10 of the farms whose soil scores have regressed are currently below 77%. The highest current soil score is 89%, whereas the lowest is 56%.
Water score
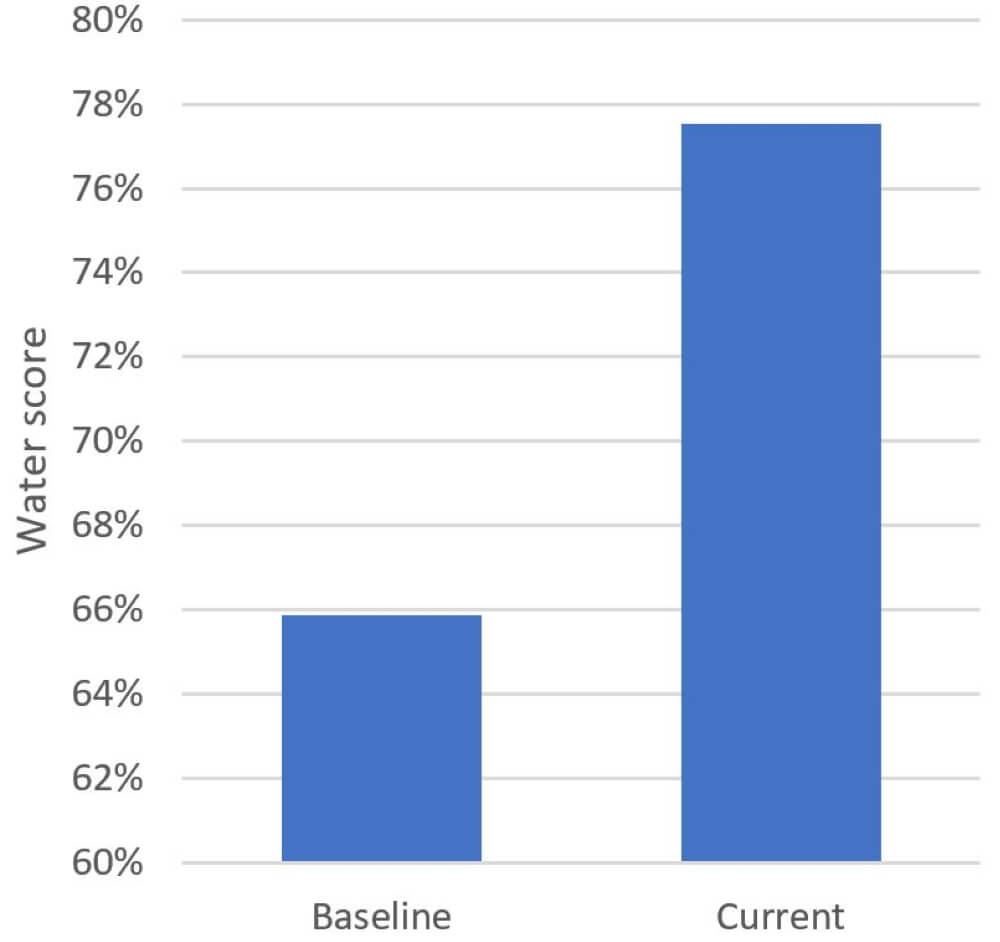
The water score is based on how effectively the farm uses water. We measure how many litres of water the farmer uses to produce a litre of milk. The more water they use, the lower the water score is. The drought has also significantly influenced this score, although in a positive manner. Due to there being so much less water available, the water use efficiencies on farm have become much better.
The average water score on the 38 farms included increased from a baseline of 66% to the current average of 78%. There are 23 (61%) farms which have improved, and 15 (39%) which have regressed. Of those 15, only 4 have scores below 78%.
Figure 3: Baseline versus current Water score on 38 Trace & Save farms
Atmosphere score
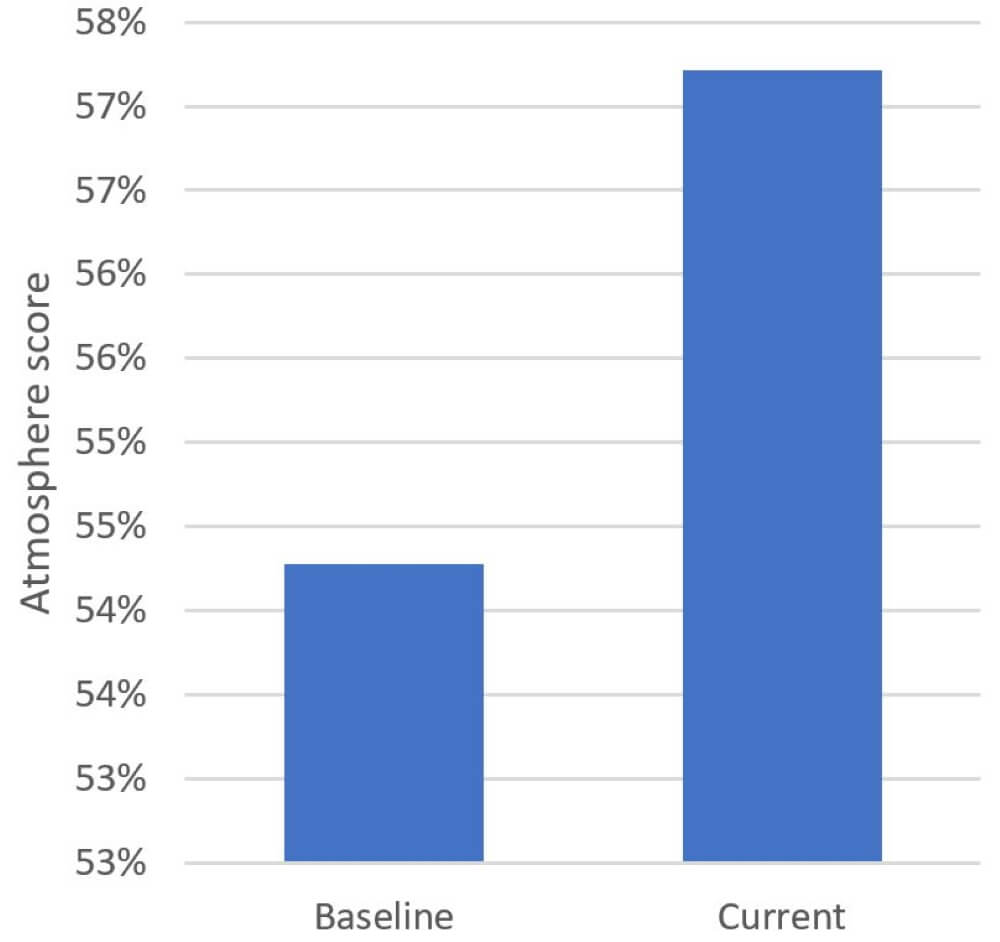
Figure 4: Baseline versus current Atmosphere score on 39 Trace & Save farms
The atmosphere score reflects the farms carbon footprint. The higher a farm’s carbon footprint, the lower their atmosphere score will be. One of our big drives has been to get farmers to reduce their carbon footprints.
We have been encouraged to see that 25 (64%) of 39 farms have improved. With the overall average for all 39 farms improving from a baseline of 54% to a current score of 57%. Only 7 of the farms which have regressed have current scores of below 57%.
Nutrient score
The nutrient score tells us how efficiently farmers have been converting the feed and fertiliser that they buy onto the farm into the valuable produce that leaves the farm. Not only is this a good productivity indicator, the amount of excess nutrients also gives us an idea of pollution potential. Therefore, the higher the nutrient score, the less pollution there is on that farm.
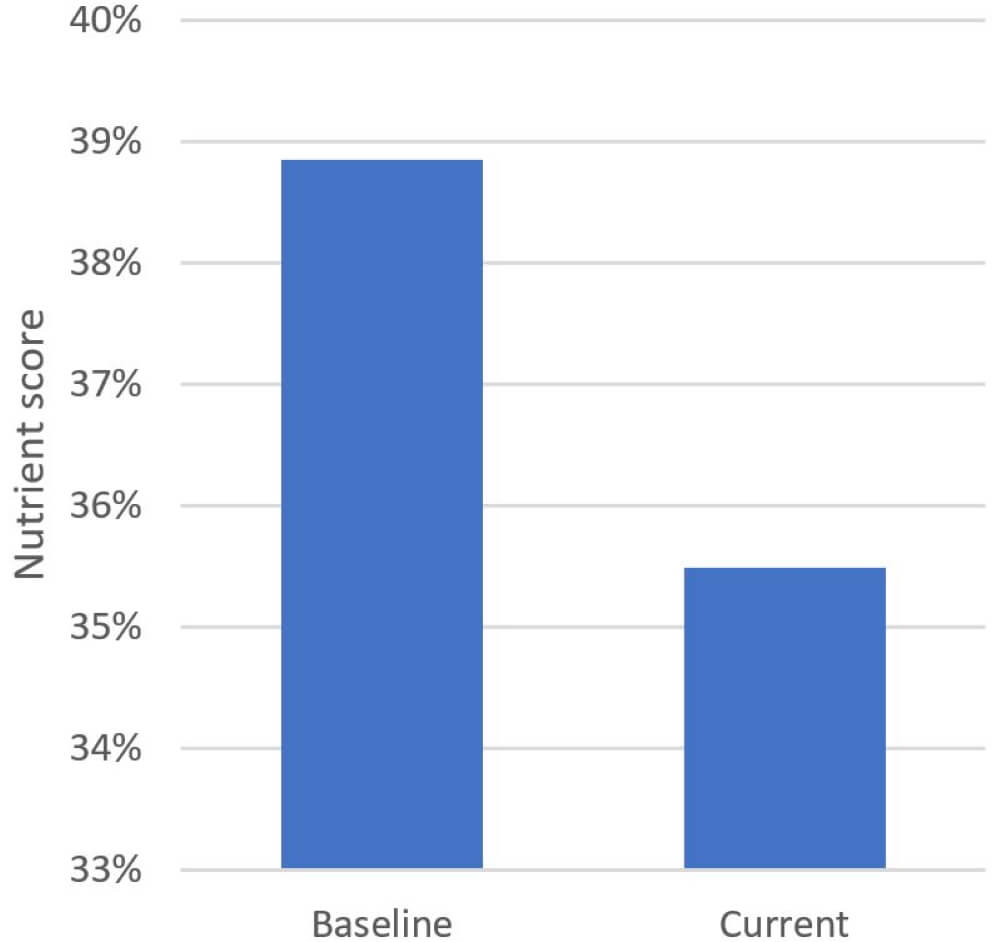
The nutrient score is the only one which has not improved since the baseline. The baseline score was 39%, whereas the current score is 35%. Half of the farms (20) have improved, whereas the other half have regressed. Of the 20 farms which have regressed, only 3 have a baseline above 35%.
The nutrient scores show that there is a lot of room for improvement in nutrient management on the farms we work with. The drought has made it challenging, but we are working with our farmers to ensure that these results improve over the next few years.
Figure 5: Baseline versus current Nutrient score on 40 Trace & Save farms
Conclusion
When looking at all four aspects of the SWAN system, there are only 3 farms which have regressed in every area, and 4 farms that have regressed in three areas. This means that the very large majority of farms showed improved in at least two areas.
I understand that some of these changes might not seem significant, but every bit of improvement is hard earned by the farmers. The last four years have been very tough from the drought perspective. We have been very encouraged to see any improvement at all. Most farmers working with us have really shown a strong desire to improve the sustainability of their farms and have been reaping the rewards!
- A carbon footprint assessment for pasture-based dairy farming systems in South Africa - 2024-02-07
- What progress have farms participating with Trace & Save made over the past 10 years? - 2023-09-06
- Carbon footprint reduction over time: Lessons from pasture-based dairy farms in South Africa - 2023-09-04
