Sustainable agriculture often suffers from a case of lots of theory but not much relevant data to back up how it has worked practically. Trace & Save would like to change that by sharing case studies of how farms have become more sustainable over time through the implementation of good management practices. The farms included in these case studies are pasture-based dairy farms in South Africa.
Introduction
One of the goals of Trace & Save over the past eight years has been helping farmers to reduce their reliance on nitrogen fertiliser. We often reference levels which farmers have gotten to, but do not have a compiled record of some of these figures. This case study will serve as a reference point for what some farmers have achieved with regards to improving the efficiency of nitrogen fertiliser.
The best measure for this purpose on pasture-based farms is to look at the amount of nitrogen fertiliser used to grow a ton of grass. This will be the measure for this case study – the more efficiently nitrogen fertiliser can be converted into pasture, the cheaper it is to grow those pastures and the lower the negative environmental impact. Not only that, but the more a soil is weaned from nitrogen, the more the soil life is activated to mineralise, the less the soil and plants rely on external nitrogen inputs. This is a journey that farmers have embarked on over the past few years. It is very much a process, and we do not advocate for farms to simply apply less nitrogen. There is a lot of work that needs to be done in restoring soil to a healthy state, before nitrogen can be significantly cut. One of the mechanisms that has been extensively used is the inclusion of legumes (e.g. lucerne and clover), which fix their own nitrogen from the atmosphere, and releasing the N when they die thus decreasing the pastures requirement for nitrogen inputs.
This case study will not explore in-depth how farms have achieved this, there are many other blogs that fulfil this purpose. The aim is rather to provide evidence that it has happened – both to address sceptics, and to encourage farmers that there is always room for improvement.
Case study farms
The data for this case study comes from five farms. Three in the Tsitsikamma, one in George and one in Cookhouse. The three Tsitsikamma farms are mixed irrigation and dryland, whereas the other two farms only have data for irrigated pastures. All five farms have multispecies pastures predominantly containing various mixtures of kikuyu-ryegrass or lucerne-ryegrass with chicory, white clover, red clover and plantain. It should be noted that these areas have been in significant drought over the time period which this data was collected, which makes the improvement even more impressive.
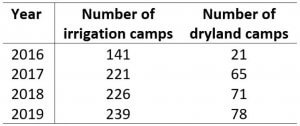
The data are from the past four years, as of October 2019. The data are grouped into 2016 (November 2015 – October 2016); 2017 (November 2016 – October 2017); 2018 (November 2017 – October 2018) and 2019 (November 2018 – October 2019). For one of the farms, there is no data for 2016. The number of camps included in the analysis per year are shown in Table 1 below. The numbers are inconsistent as farms grew over time, adding more camps. The average camp was 7.74 hectares for irrigation, and 6.94 hectares for drylands.
Table 1: Number of irrigation and dryland camps for each year included in the case study
Results
Fertiliser application rate
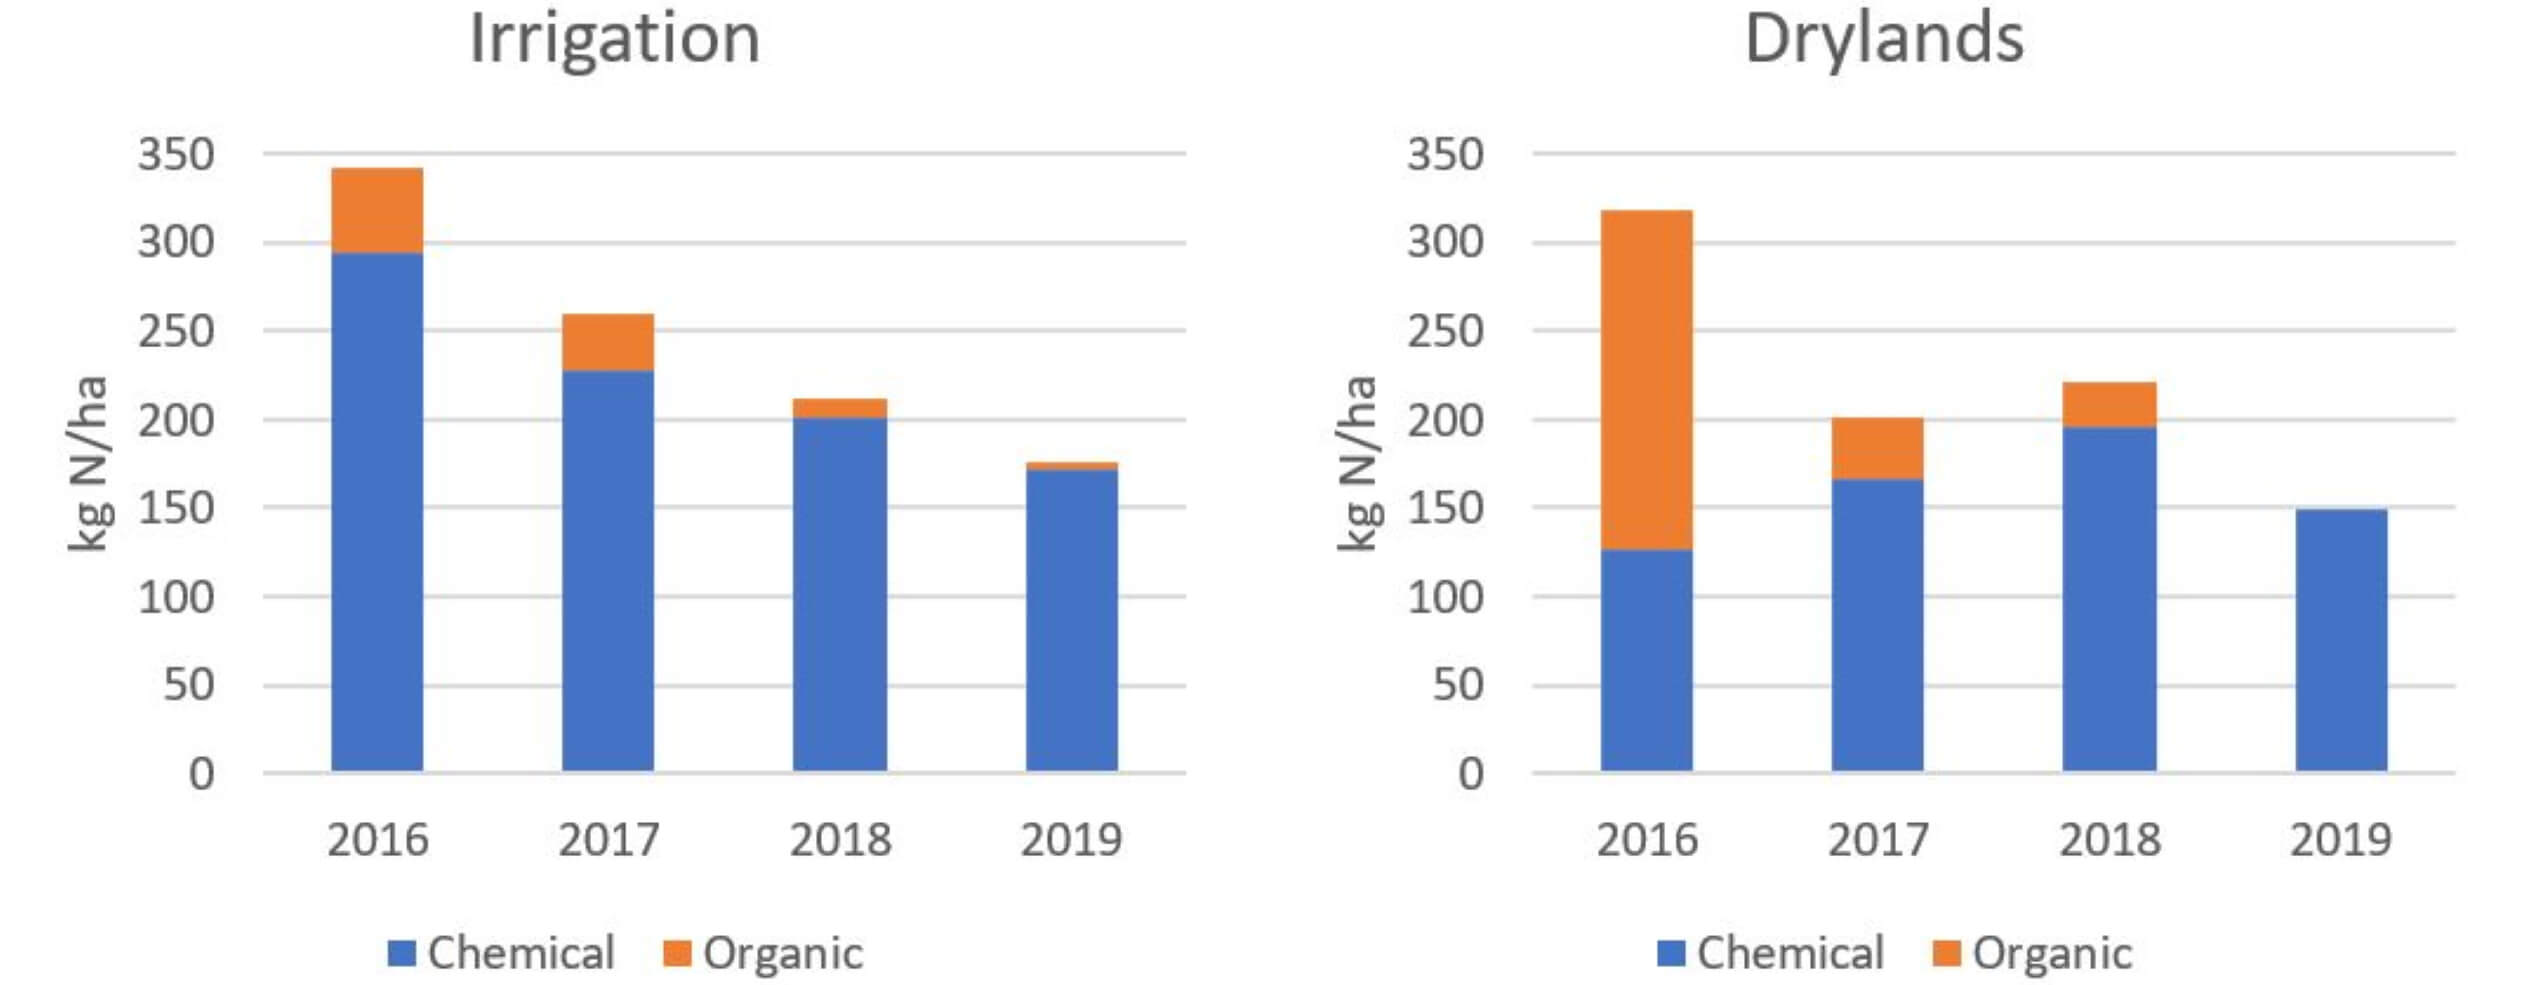
Before even looking at the efficiency of nitrogen fertiliser, it is interesting to look at the trends of application rates on these five farms. As can be seen in Figure 1, in 2016, 342 kg of N/ha was applied on irrigated pastures, and 318 kg N/ha on drylands. These application rates reduced to 176 and 149 kg N/ha on irrigation and drylands respectively. Something that is also interesting to note is the reduction in organic N application.
The maximum chemical fertiliser application rate on an individual camp was 1 065 kg N/ha on irrigation in 2016. This maximum reduced to 891 kg N/ha in 2017, to 467 kg N/ha in 2018 and to 338 kg N/ha in 2019.
Figure 1: Average nitrogen fertiliser application rate per hectare per year from chemical and organic fertiliser sources
Pasture growth
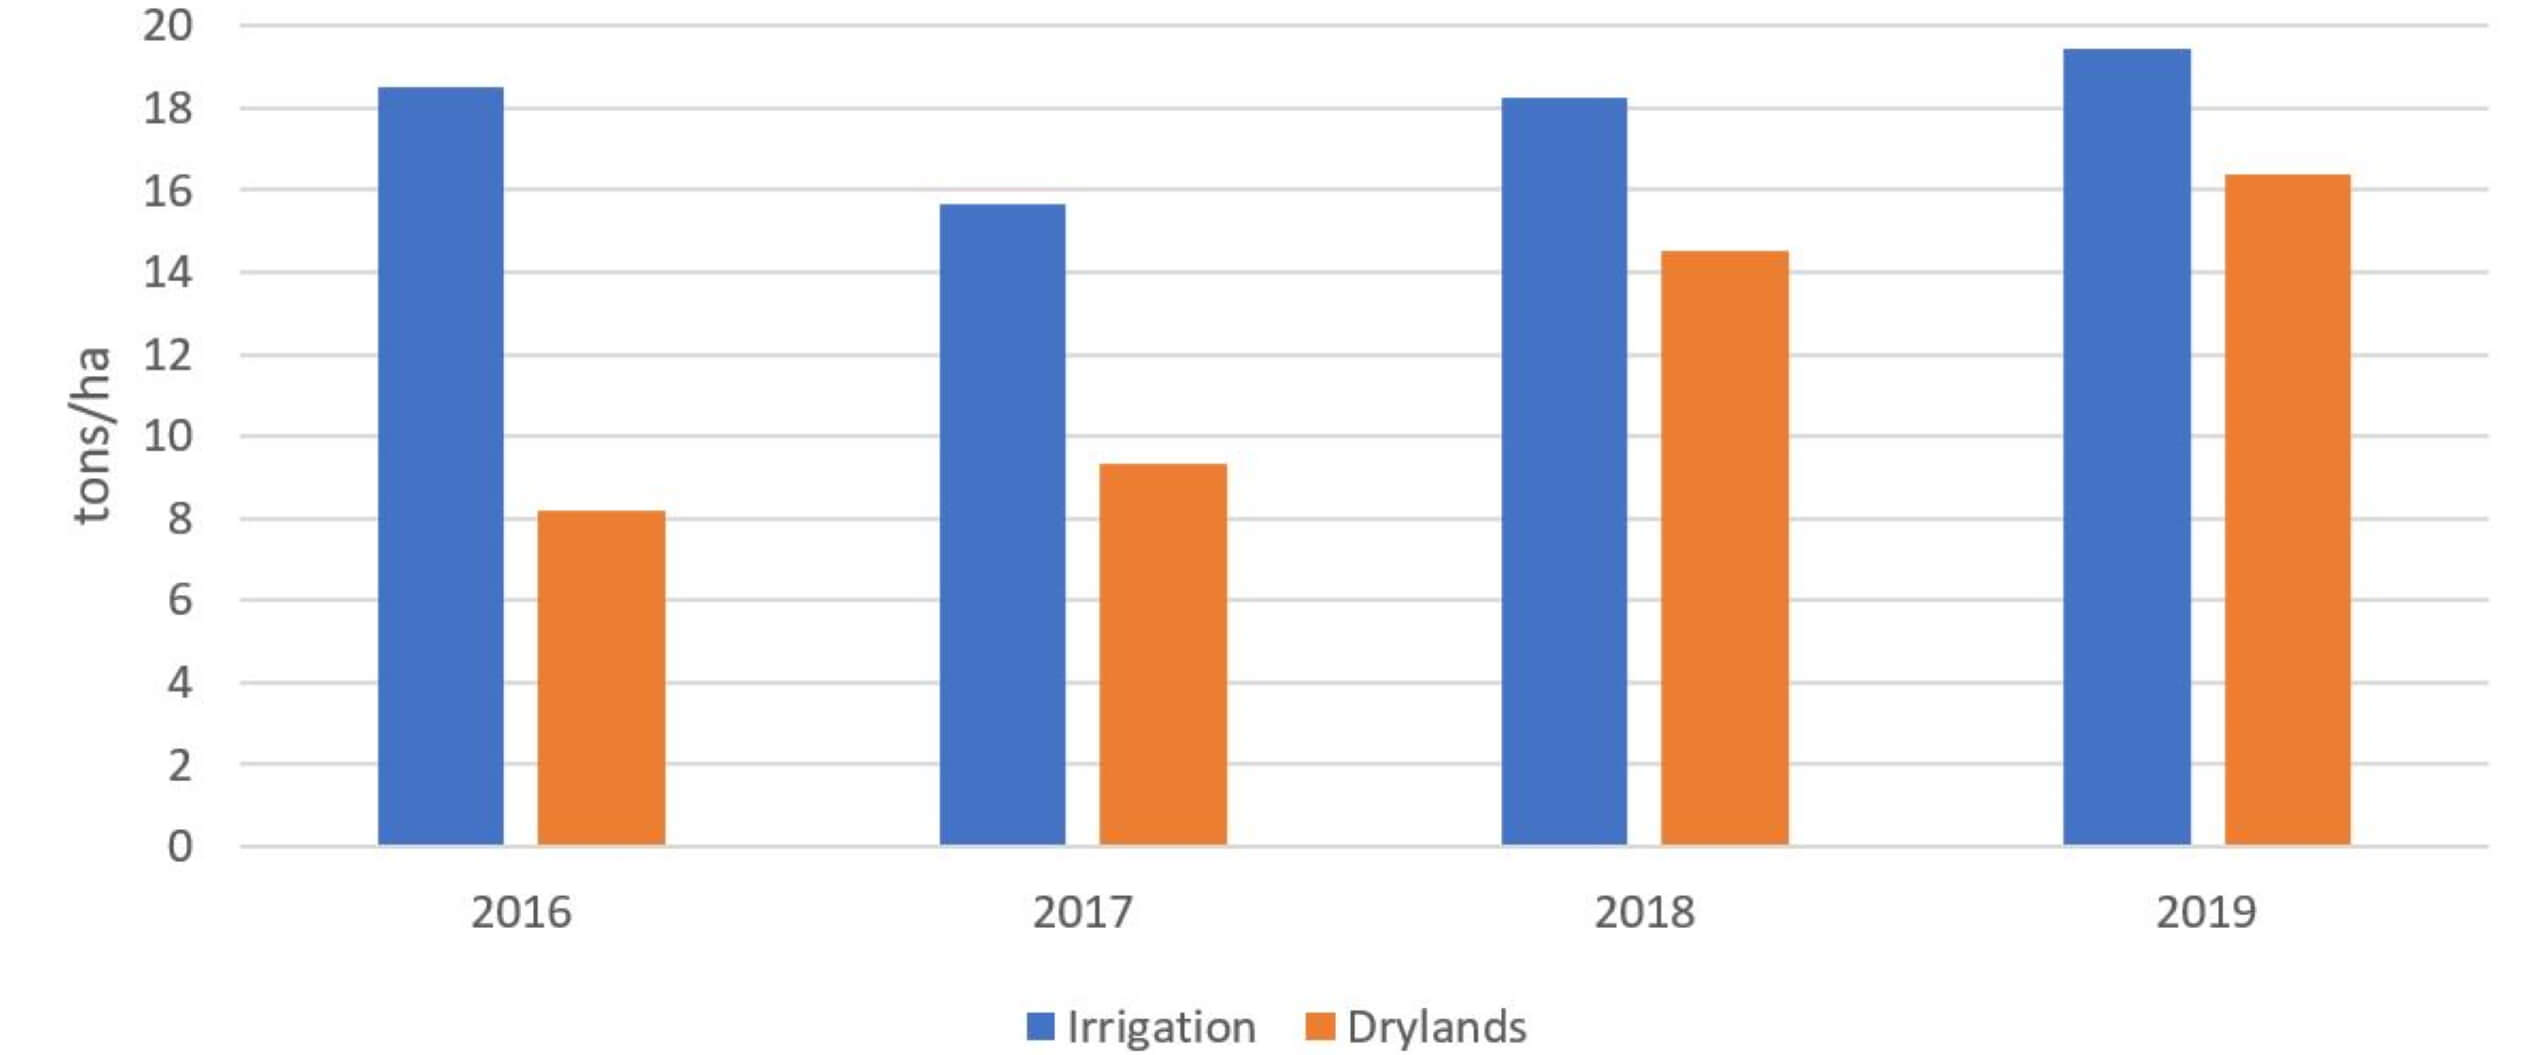
Obviously, it is not beneficial to farmers to simply drop nitrogen fertiliser rates, the pastures still need to grow at optimal rates. Figure 2 shows the average growth rates for irrigation and dryland pastures over the four years of the case study. Under irrigation, the pastures grew 18.5 tons/ha in 2016, which dipped in 2017 (the harshest drought year), increased in 2018 (still drought) and was at its highest in 2019, 19.4 tons/ha. The drylands, surprisingly, showed a steady increase from 2016, at 8.2 tons/ha, to 2019, at 16.4 tons/ha.
Figure 2: Average growth rates on irrigated and dryland pastures from 2016 to 2019
Nitrogen efficiency
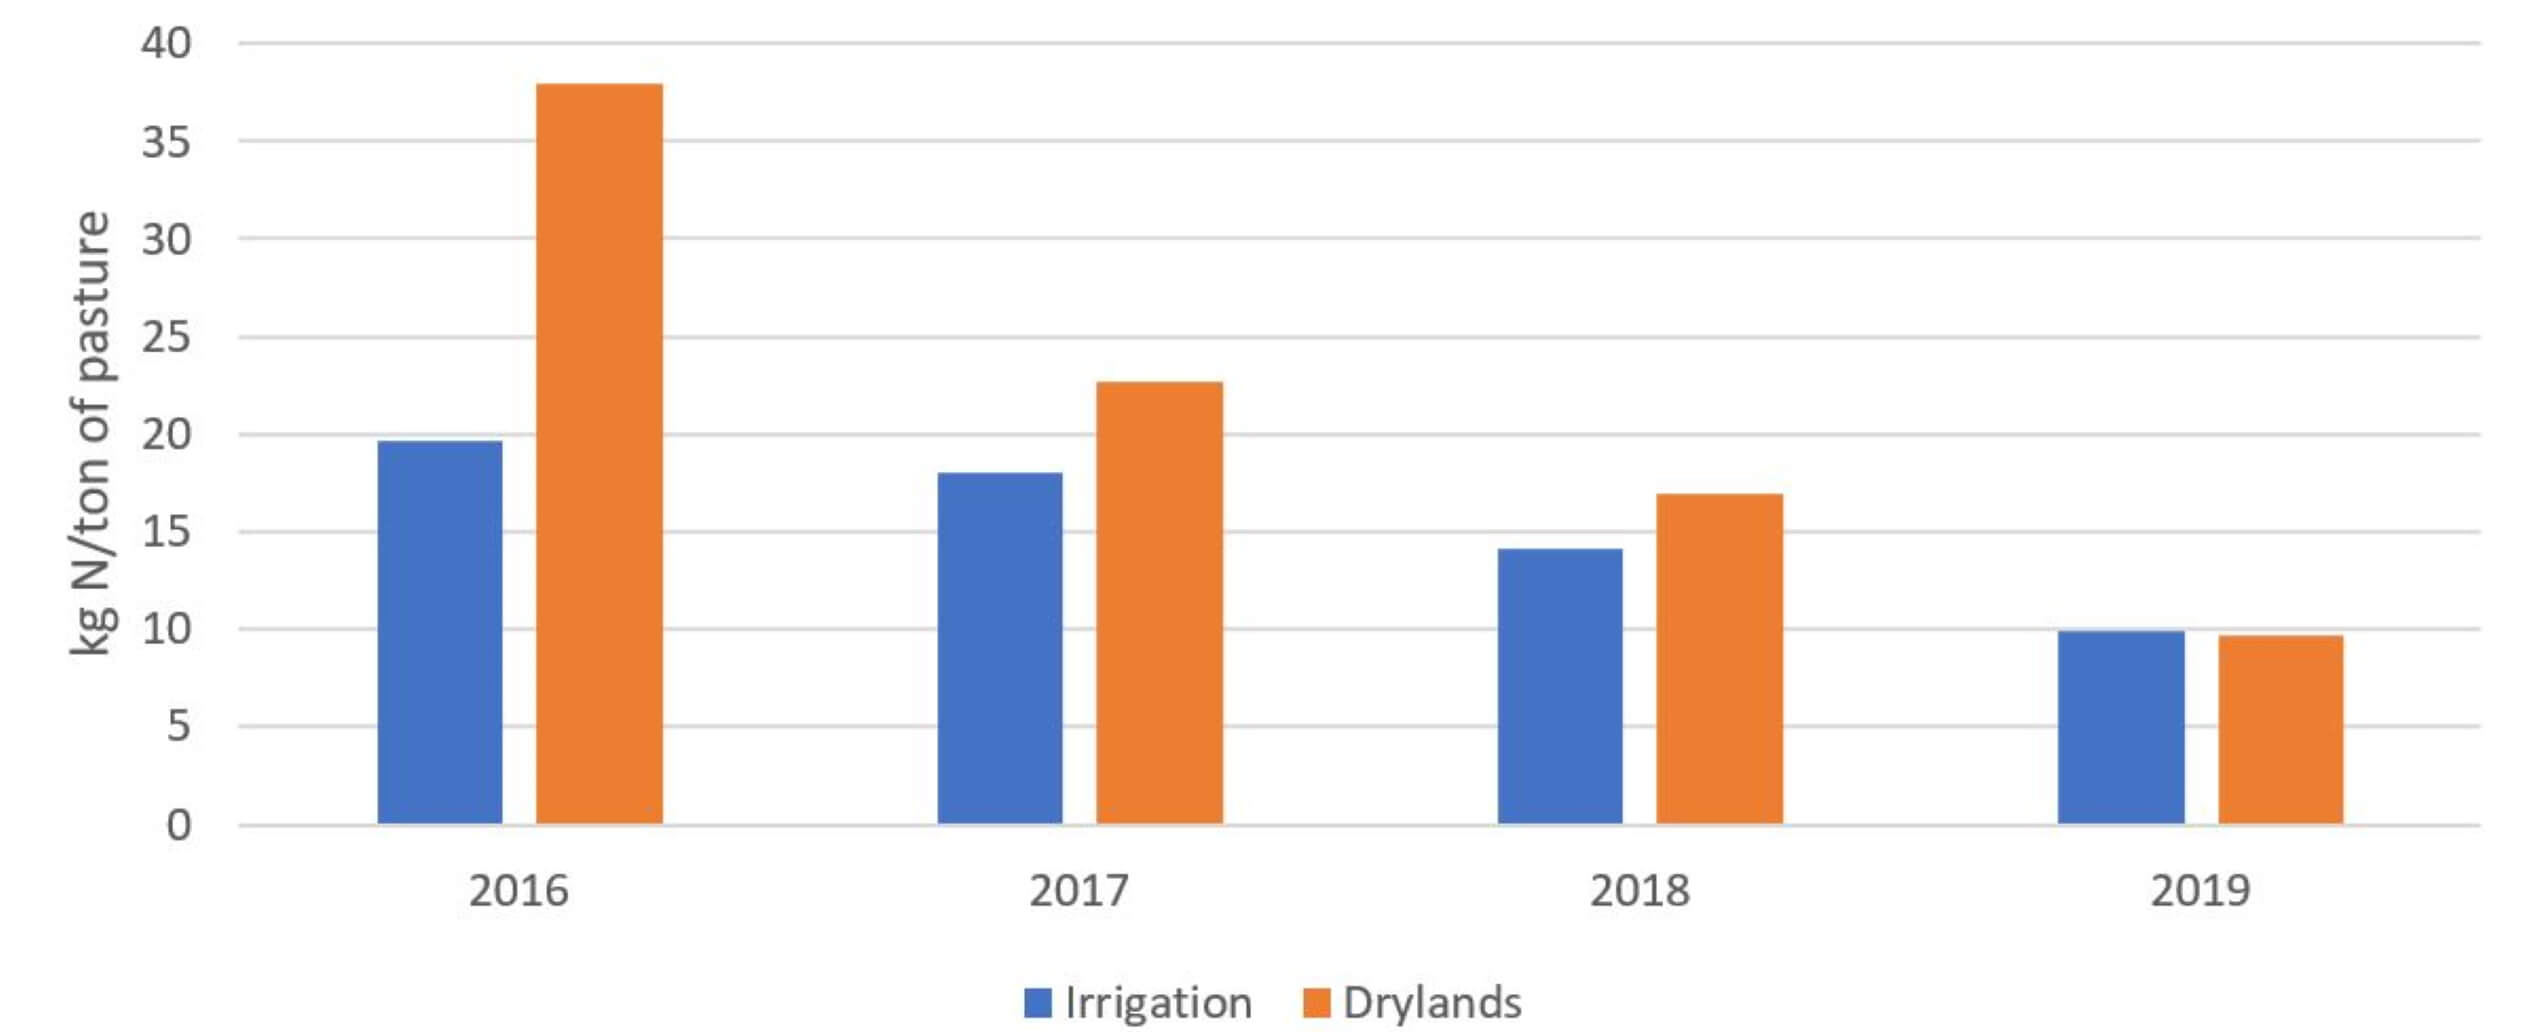
When comparing nitrogen fertiliser rates with pasture growth, the key figure of efficiency is how much fertiliser it took to grow a ton of pasture. Figure 3 shows how the efficiency of nitrogen fertiliser has improved over the past four years. Under irrigation these five farms have used, on average, half the nitrogen fertiliser per ton of pasture grown. On the drylands, this figure has improved even more, with the farms only using a quarter of the nitrogen fertiliser they previously used to grow a ton of pasture.
Figure 3: Average nitrogen fertiliser efficiency on irrigated and dryland pastures from 2016 to 2019
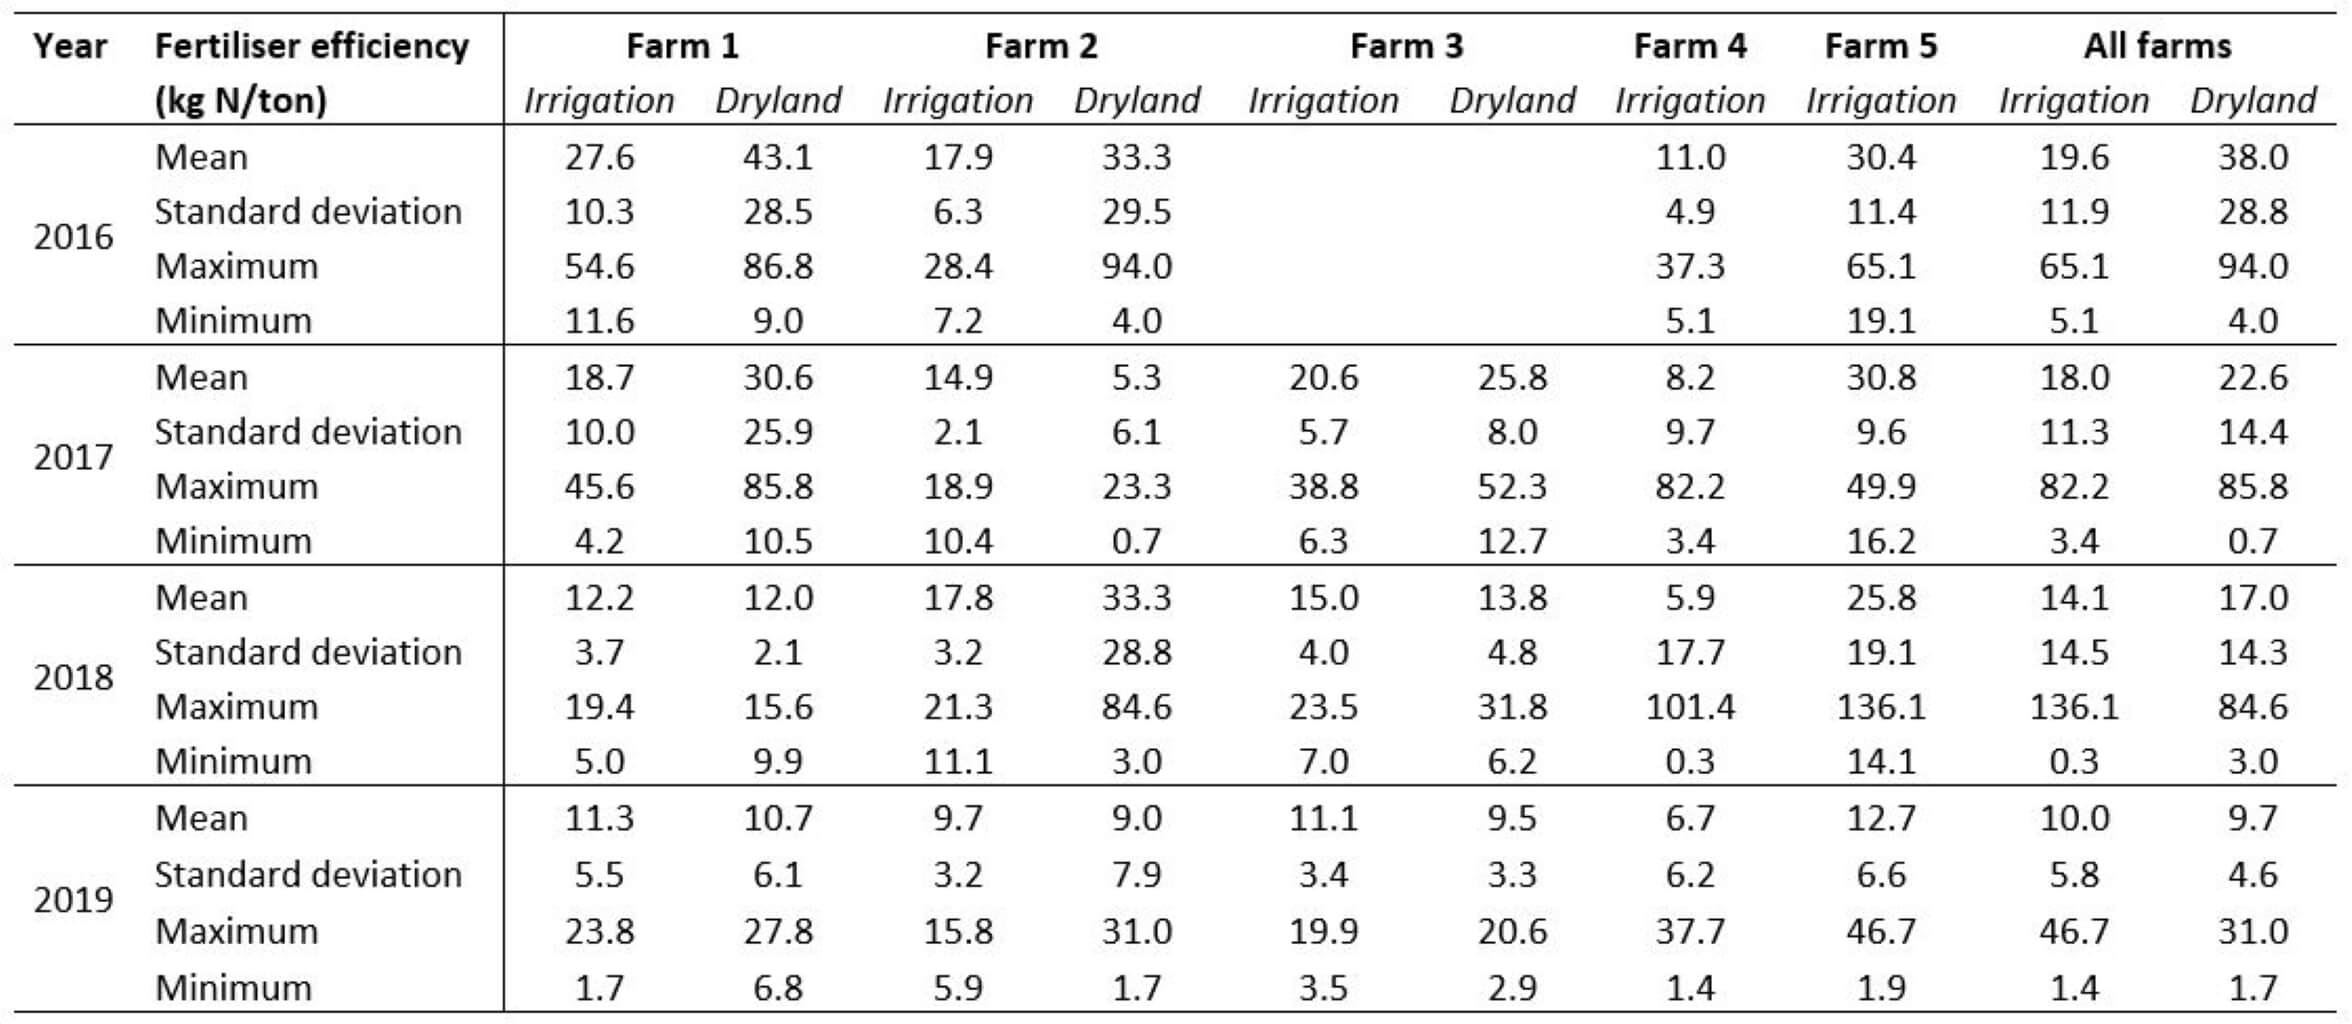
Table 2 gives some of the more detailed statistics for anyone who might be interested in such figures. Something interesting to note from this table is that along with the average N fertiliser efficiency improving each year, standard deviations, maximum and minimums also all decrease, re-enforcing the trend.
Table 2: Descriptive statistics of nitrogen fertiliser efficiency for each farm and each year
Discussion
It is clear from the results that these five farms have drastically improved the efficiency with which they convert fertiliser into pasture. They have done this by using a lot less fertiliser – both chemical and organic forms, while improving the tons produced.
On a side note, the reason why organic nitrogen has become so much less is due to the phosphorous and potassium levels in the soil which have become higher. Phosphorous and potassium are no longer necessary, therefore organic forms of fertiliser which contain N, P and K are no longer a viable option (I will do a follow-up case study which shows the decrease in overall N, P and K fertiliser cost on these same farms over the four years).
One of the biggest arguments against reducing N fertiliser rates that I have heard is that pasture growth will be sacrificed. That is obviously not true on these farms, on the contrary. The keys to this improvement in efficiency are improved soil health, the inclusion of legumes in pastures and optimal grazing management. I will list some blogs below which cover these topics, so I will not get into discussing them here (there are many more on our website). Suffice to say that the proof is in the pudding on these farms when it comes to the benefit of improving the health of soils, diversifying pasture species and ensuring that grazing is managed effectively.
Tapping into the tons of nitrogen above the soil
Grazing management: The key to sustainable pasture-based farming
A point that needs to be noted is that these farmers have ‘earned the right’ to use less fertiliser. We are not advocating for an outright drop in fertiliser application rates without understanding the context of the farm. Some farms do not have good enough soils to radically reduce their fertiliser rates, some farms do. This could even be on a camp-to-camp basis within a farm. I always tell farmers to first place to start is by looking at how much fertiliser they apply per application. I find that many farmers are applying way too much fertiliser at a time. This is simply wasteful, and a farmer does not need to improve their soils to take this first step in improving N fertiliser efficiency.
Reduced fertiliser not only saves farmers money, but it reduces the negative environmental impact of growing pastures. More efficient nitrogen use means less excess nitrogen results in pollution of the atmosphere and water sources.
Conclusion
I hope that this case study settles the question of whether it is possible to reduce nitrogen fertiliser to below what has previously been thought of as optimal. If you ask them, all five of these farmers will tell you that they have lots of room for improvement. The next threshold is to get the farm average below 5 kg of N per ton of pasture – that is 20 tons of pasture with less than 100 kg of N/ha. It is already happening in some camps, so I know if is possible. I am always encouraged by the fact that it is farmers who keep pushing the boundaries and setting the next efficiency target.
I also hope this case study encourages farmers who are in the process of adapting their management in order to achieve greater efficiency. It is possible, but it does not happen overnight. Keep working at it!
- A carbon footprint assessment for pasture-based dairy farming systems in South Africa - 2024-02-07
- What progress have farms participating with Trace & Save made over the past 10 years? - 2023-09-06
- Carbon footprint reduction over time: Lessons from pasture-based dairy farms in South Africa - 2023-09-04

